Recommended resources
The freely available resources this lesson will direct you to.
- Introduction to k-Means Clustering with scikit-learn in Pythonwww.datacamp.com
- K-Means Clustering Algorithm with Python Tutorialwww.youtube.com
- Machine Learning Tutorial Python - 13: K Means Clustering Algorithmwww.youtube.com
- K-Means Clustering in Python: A Practical Guiderealpython.com
- Getting started with K-means clustering in Pythondomino.ai
Hello! Welcome back to our course on AI Engineering.
In our previous lessons, we've focused on supervised learning, where we trained models like logistic regression and random forests using data that already had known labels (e.g., "Hall of Fame" or "Not"). We taught the model to predict these labels.
Today, we pivot to a different and equally fascinating area of machine learning: unsupervised learning. Here, we work with data that has no labels. Our goal isn't to predict a known outcome, but to discover hidden structures, patterns, or groups within the data itself.
The first unsupervised technique we'll explore is k-means clustering, a powerful and popular algorithm for automatically grouping similar data points together.
By the end of this 60-minute lesson, you will be able to:
- Perform k-means clustering on an unlabeled dataset using Scikit-learn.
- Understand why feature scaling is critical for k-means.
- Use the "Elbow Method" to help choose the optimal number of clusters.
Let's begin our journey into finding patterns in the unknown.
1. What is Clustering?
Clustering is the task of grouping a set of objects in such a way that objects in the same group (called a cluster) are more similar to each other than to those in other groups. Imagine a scatter plot of unlabeled points; clustering algorithms help us draw circles around the natural groupings.
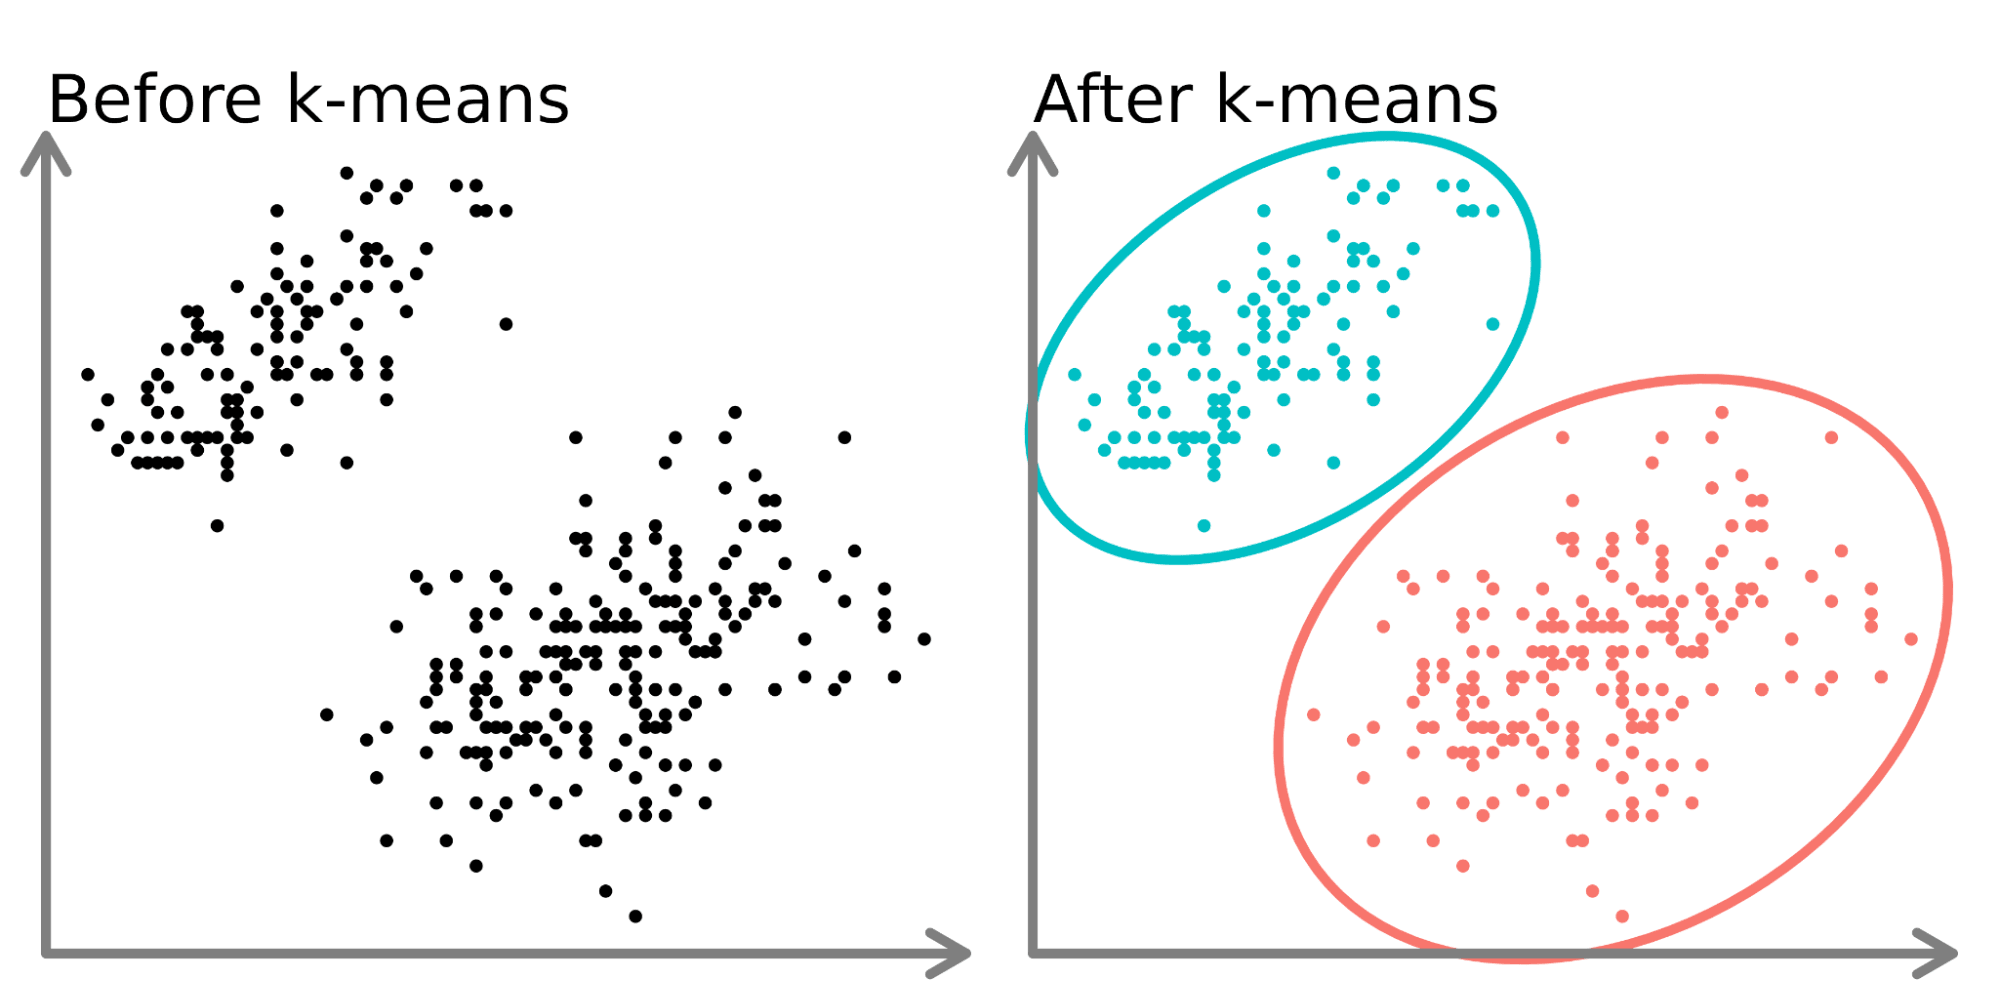
The k-means algorithm is one of the most widely used clustering algorithms. Its goal is to partition data into k predefined, non-overlapping clusters.
2. The K-Means Algorithm: An Intuitive Walkthrough
At its core, the k-means algorithm is an iterative process that refines its cluster assignments until it finds the best possible groupings. Here’s how it works conceptually:
- Choose k: You first decide how many clusters (k) you want to find.
- Initialize Centroids: The algorithm randomly places k "centroids" in your data space. A centroid is a point that represents the center of a cluster.
- Assign Points to Clusters: Each data point is assigned to its nearest centroid. This forms the initial k clusters.
- Update Centroids: The center of each cluster is recalculated by taking the mean of all data points assigned to it. This new center becomes the new centroid.
- Repeat: Steps 3 and 4 are repeated. With each iteration, the centroids move, and points may be reassigned to a different cluster. This process continues until the centroids no longer move significantly, meaning the clusters have stabilized.
The algorithm's objective is to minimize the Sum of Squared Errors (SSE), also known as inertia. This is the sum of the squared distances between each data point and its cluster's centroid. A lower SSE means the points are, on average, closer to their cluster centers—a sign of a more compact and well-defined clustering.
To see this iterative process animated, please watch the first part of the following video.
Machine Learning Tutorial Python - 13: K Means Clustering Algorithm
This video from codebasics provides an excellent visual explanation of how the k-means algorithm works step-by-step.
Watch from the beginning until 04:37. \nFocus on the visualization of the two steps: Assignment: Points are colored based on the closest centroid. Update: The centroids are moved to the center of their newly assigned points.
3. Implementing K-Means with Scikit-learn
Now, let's translate this theory into Python code. You'll find that the Scikit-learn workflow is very familiar. However, there's a critical preprocessing step we must address first: feature scaling.
The Importance of Feature Scaling
K-means relies on calculating the Euclidean distance to determine the "nearest" centroid. If your features are on vastly different scales (e.g., age from 20-70 and income from 40,000-160,000), the feature with the larger range (income) will completely dominate the distance calculation. This can lead to poorly formed, distorted clusters.
To prevent this, we must scale our features so they are on a comparable range. A common technique is MinMaxScaler, which scales all features to a range between 0 and 1.
The next video segments perfectly illustrate this problem and its solution.
Machine Learning Tutorial Python - 13: K Means Clustering Algorithm
Let's continue with the codebasics video to see a practical demonstration of training k-means, first without scaling and then with scaling.
Please watch from 07:31 to 17:18. (07:31 - 14:06): Pay attention to the initial, incorrect clustering results when the Age and Income features are not scaled. This highlights the problem clearly. (14:06 - 17:18): This is the crucial part. Observe how MinMaxScaler is used to transform the features to a 0-1 range. Note that the scaler is fit and transformed on each feature separately here for demonstration.
Training on Scaled Data and Visualizing Results
Once the data is properly scaled, we can train the k-means model and expect much better results. The process is straightforward:
- Import
KMeansfromsklearn.cluster. - Instantiate the model, specifying
n_clusters=k. - Use
.fit_predict()on the scaled data to both train the model and get the cluster assignments for each data point. - Visualize the results by creating a scatter plot and coloring the points based on their assigned cluster labels.
Let's see the final code in action.
Machine Learning Tutorial Python - 13: K Means Clustering Algorithm
This final coding segment shows how to re-run the algorithm on the scaled data and visualize the much-improved clusters.
Please watch from 17:18 to 20:56. Note how the predicted cluster labels are added back to the DataFrame to facilitate plotting. Observe the visualization of the final cluster centroids (km.cluster_centers_), which represent the learned center of each group.
4. Choosing the Right Number of Clusters (k)
So far, we've been assuming k=3. But how do we know this is the right number? Choosing k is a critical hyperparameter decision in k-means.
One of the most common methods for this is the Elbow Method. The idea is to run the k-means algorithm several times with an increasing number of clusters (e.g., k=1, 2, 3, ..., 10) and record the SSE (inertia) for each run.
When we plot SSE against k, the graph typically looks like an arm. The SSE will decrease as k increases (more clusters will always fit the data better). However, the rate of decrease will slow down. The point where the plot "bends" or forms an "elbow" is a good candidate for the optimal value of k. This point represents a good balance between minimizing the error (low SSE) and keeping the number of clusters manageable.
Machine Learning Tutorial Python - 13: K Means Clustering Algorithm
Let's first understand the theory behind the elbow method, and then see how to implement it in code.
Please watch from 04:37 to 07:31 for the theoretical explanation, and then from 20:56 to 24:10 for the Python implementation. Theory (04:37 - 07:31): Understand how the SSE is calculated and why the plot of SSE vs. k forms an elbow. Implementation (20:56 - 24:10): Focus on the for loop that iterates through different values of k. For each k, a new KMeans model is trained, and its inertia_ attribute (Scikit-learn's name for SSE) is stored. Finally, these values are plotted to find the elbow.
Based on the elbow plot in the video, k=3 was indeed a very good choice for that dataset.
Key Takeaways
- K-Means is an unsupervised clustering algorithm that groups unlabeled data into k distinct clusters.
- It works by iteratively assigning points to the nearest centroid and then updating the centroid's position.
- Feature scaling is essential for k-means because it is a distance-based algorithm. Features with larger scales can disproportionately influence the outcome.
- The Elbow Method is a useful heuristic for finding the optimal number of clusters (k) by plotting the inertia (SSE) for a range of k values and finding the "bend" in the curve.
- The Scikit-learn workflow remains consistent. We import
KMeans, instantiate it with hyperparameters liken_clusters, and fit it to our data. The results are available in attributes like.labels_and.cluster_centers_.
What's Next?
Fantastic work! You have now implemented your first unsupervised learning algorithm and learned how to tackle some of its unique practical challenges, like choosing k and the importance of scaling.
In our journey through Scikit-learn, we've often tuned hyperparameters by manually changing them and re-running the code. This is fine for simple cases, but not efficient. In the next lesson, we will learn about cross-validation and grid search, a systematic and robust methodology for finding the best hyperparameters for any model, whether it's for classification, regression, or even clustering.