Recommended resources
The freely available resources this lesson will direct you to.
- 14: Distributed Logging & Metrics Framework | Systems Design Interview Questions With Ex-Google SWEwww.youtube.com
- Distributed Logging System Design with Ex-Amazon SDEwww.youtube.com
- Cloudflare incident on November 14, 2024, resulting in lost ...blog.cloudflare.com
- [PDF] TitanLog: Hierarchical and Elastic Logging for High-speed Network ...yangtonghome.github.io
Hello! Welcome to the third lesson in our module on architecting unified edge security platforms.
In our last lesson, we designed a system inspired by Cloudflare's Quicksilver to distribute security policies to our global edge network. We solved the challenge of propagating configuration from a central control plane to tens of thousands of servers reliably and with low latency.
Now, we must solve the inverse problem. Our global fleet of edge servers generates an immense stream of data—security events, performance metrics, access logs. On a typical day, a large CDN can process trillions of log events. How do we collect this firehose of data from the edge, transport it to a central location for analysis, and do so without impacting the performance of the edge servers themselves?
This brings us to today's learning outcome: Architect a distributed logging pipeline for a CDN edge network, focusing on high-throughput collection and centralized aggregation.
We'll design a system that acts as a massive funnel, reliably collecting data from a vast, distributed source and channeling it into centralized systems for security analysis, monitoring, and alerting.
1. The Challenge: Logging at Global Scale
Before diving into the architecture, it's crucial to understand the requirements and constraints. A logging system for a global CDN is one of the most demanding data engineering challenges.
Distributed Logging System Design with Ex-Amazon SDE
Let's start with a comprehensive overview of the problem space from the video 'Distributed Logging System Design' by Sweet Codey. This will frame our discussion by outlining the core functional and non-functional requirements.
Please watch the first three sections of the video: Introduction (00:00 - 03:50): This explains why centralized logging is necessary, highlighting the problems of scattered logs in distributed architectures. Functional Requirements (03:50 - 07:35): Pay attention to the five key requirements: unified collection, efficient search, distributed storage, visualization, and retention. Non-Functional Requirements (07:35 - 11:17): Focus on the critical demands of low latency, high scalability (e.g., 300,000 logs/sec), high availability, and security.
As the video outlines, our system must not only collect logs but also make them searchable, visualizable, and available for the long term. The non-functional requirements are particularly severe in a CDN context:
- Minimal Performance Intrusion: The logging process on an edge server must be lightweight and asynchronous, so it doesn't slow down the primary task of serving traffic.
- Extreme Scalability & Throughput: We need to handle trillions of events per day, which translates to millions of events per second during peak times.
- High Availability & Reliability: The logging system must be more reliable than the services it monitors. Log loss can mean blind spots during a security incident or incorrect customer billing.
2. High-Level Architecture: A Multi-Stage Funnel
A naive approach where every edge server sends its logs directly to a central database would instantly fail. The central database would be overwhelmed, creating a massive bottleneck. A robust architecture uses a multi-stage "funnel" to gradually aggregate and process the data.
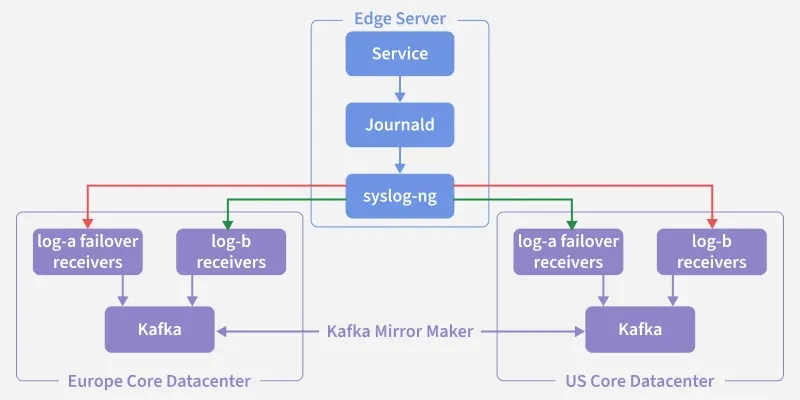
Let's break down the journey of a single log event through this pipeline.
Distributed Logging System Design with Ex-Amazon SDE
The 'Distributed Logging System Design' video provides an excellent end-to-end walkthrough of this funnel architecture. We'll watch the relevant sections as we break down each stage.
We will go through this video in parts. For now, please watch the section 'Collecting and Buffering Logs' (11:17 - 17:06). This covers the first two stages of our pipeline: collecting logs from microservices and buffering them in Kafka.
Stage 1: Edge Collection
- Source: Services running on thousands of edge servers generate logs.
- Agent: A lightweight log agent (e.g., Filebeat, Fluent Bit, or a custom service) runs on each server. Its job is to:
- Tail local log files or listen on a local socket.
- Add metadata to each log entry (e.g., server hostname, PoP location, service name).
- Serialize the logs from a human-readable format like JSON into a compact binary format like Protocol Buffers (Protobuf). This drastically reduces the amount of data sent over the network.
- Batch the serialized logs and send them asynchronously to the next stage.
- Key Principle: The agent is designed to be a non-blocking "fire-and-forget" shipper. Its local buffer handles transient network issues, but its main goal is to get logs off the server as efficiently as possible.
Stage 2: Regional Ingestion & Buffering
- The "Mail Room": The log agents from all edge PoPs in a geographic region (e.g., Europe) send their log batches to a regional "core datacenter". The entry point to this datacenter is a distributed message queue, with Apache Kafka being the industry standard.
- Why Kafka?
- Buffering: Kafka acts as a giant, durable buffer. It absorbs the massive, spiky influx of logs from the edge and allows downstream systems to consume them at a more controlled pace. This decouples the high-velocity data producers (edge agents) from the data consumers (processing engines).
- Durability: Kafka persists messages to disk and replicates them, providing strong guarantees against data loss.
- High Throughput: It's designed from the ground up to handle millions of messages per second.
Stage 3: Stream Processing
Now that the logs are safely buffered in Kafka, we need to process them. This is the job of a stream processing engine like Apache Flink or Apache Spark Streaming.
Distributed Logging System Design with Ex-Amazon SDE
Let's continue with the 'Distributed Logging System Design' video. The next section explains the crucial role of Apache Flink.
Please watch the section 'Processing with Apache Flink' (17:06 - 21:24). Focus on the five key tasks Flink performs: parsing, enrichment, filtering, aggregation, and routing.
Flink pulls logs from Kafka and performs several transformations in real-time:
- Parsing & Validation: It deserializes the logs from Protobuf back into a structured format and validates the schema.
- Enrichment: It adds more context. For example, it might take a source IP address and join it with a GeoIP database to add the country of origin.
- Filtering: It drops unnecessary data. For instance, verbose
DEBUGlogs might be discarded in production to save storage costs. - Aggregation: It can compute metrics over time windows (e.g., the number of 404 errors per minute for a specific customer) and emit these as new, smaller data streams.
- Routing: Finally, Flink acts as a traffic controller, sending the processed logs and metrics to different destinations based on their purpose.
Stage 4: Centralized Storage & Querying
The processed data from Flink lands in specialized storage systems, optimized for different use cases.
Distributed Logging System Design with Ex-Amazon SDE
The final stages in the 'Distributed Logging System Design' video cover the storage and visualization layers. This explains where the data ends up and how users interact with it.
Please watch the last two main sections: 'Storage Backends' (21:24 - 26:48): Understand the roles of the three different storage systems: Elasticsearch for search, TimescaleDB for metrics, and S3 for archival. 'Querying and Dashboards' (26:48 - 30:41): See how tools like Kibana, Grafana, and Athena connect to these backends to provide user-facing analytics.
This multi-destination approach is a key architectural pattern:
- For Interactive Search & Visualization (Hot Storage): Enriched, raw logs are sent to a search index like Elasticsearch or OpenSearch. These systems build an inverted index, which allows developers to perform full-text searches across trillions of logs in seconds. This is the backend for tools like Kibana.
- For Metrics & Alerting (Warm Storage): Aggregated metrics from Flink (e.g., error rates, latency percentiles) are stored in a Time-Series Database (TSDB) like Prometheus or TimescaleDB. TSDBs are highly optimized for storing and querying timestamped numerical data. This is the backend for dashboards and alerting in tools like Grafana.
- For Long-Term Archival & Batch Analytics (Cold Storage): All logs (or a filtered subset) are batched and written to a cheap, durable object store like Amazon S3. They are typically stored in a columnar format like Apache Parquet. This format is highly efficient for large-scale analytical queries run by tools like AWS Athena or Apache Spark, which often only need to read a few columns from a massive dataset.
This completes the end-to-end journey, from a single log message on an edge server to a queryable entry in a central data warehouse.
3. Case Study: Cloudflare's Logging Pipeline and a Lesson in Failure
The generic architecture we've discussed is powerful, but seeing how it's implemented and how it can fail in the real world provides invaluable lessons.
Cloudflare incident on November 14, 2024, resulting in lost logs
Cloudflare published a detailed post-mortem of a logging incident from November 2024. This document is a masterclass in the real-world complexities of operating a logging pipeline at scale. It describes their specific components and analyzes a cascading failure.
Please read this blog post carefully. As you read, map Cloudflare's components to our generic architecture: Logfwdr: The log agent on the edge. Logreceiver: A pre-processor/sorter before the main buffer. Buftee: A highly distributed, custom-built buffering system. This serves a similar role to Kafka in our model. Logpush: The consumer service that reads from the buffer and delivers logs to customers. \nFocus on the 'What happened' and 'Root causes' sections. Understand how a small configuration bug triggered a latent 'fail open' mechanism, leading to a massive overload on Buftee and causing log loss.
The Cloudflare incident is a perfect illustration of several key principles:
- Cascading Failures: A small error in one component (the configuration system for
Logfwdr) triggered a much larger failure in another (Buftee). - The Danger of "Fail-Open":
Logfwdrhad a failsafe to "fail open"—meaning if it couldn't get its configuration, it would send logs for all customers to avoid losing any. While well-intentioned, the scale had grown so much since this was designed that triggering it created a 40x traffic spike that overwhelmed the downstream buffer. - Safeguards Must Be Tested: The
Bufteesystem had a mechanism to prevent being overwhelmed by too many new buffers, but it was not configured. A safeguard that isn't active is a latent bug waiting to happen.
This incident underscores that designing the pipeline is only half the battle; designing for failure modes is just as critical.
4. Advanced Pattern: Hardware Offload with TitanLog
For maximum performance, can we do even better than a software agent on the edge server? Recent research explores offloading parts of the logging pipeline directly into network hardware.
TitanLog: Hierarchical and Elastic Logging for High-speed Network
The academic paper 'TitanLog' proposes a novel, high-performance logging architecture that uses a co-design of a programmable switch and a server. This provides a glimpse into the future of high-performance telemetry and will appeal to your interest in first-principles design.
This is a dense paper, so focus on the high-level concepts in these sections: Section II-B ('The Need for Hierarchical Logging'): Understand the core idea of logging different types of traffic at different granularities (e.g., full payload for anomalous traffic, headers-only for benign traffic). Section III ('TitanLog Overview'): Get a feel for the workflow. The key is that the programmable switch itself does the initial packet classification. Section V ('Packet Data Recorder'): Skim this to grasp how they use RDMA (Remote Direct Memory Access). The switch encapsulates packets as RDMA messages and writes them directly to the relay server's memory, bypassing the server's CPU entirely for the ingestion part. Section VI ('Adaptive Logging Manager'): Note how the system can sense resource pressure (e.g., disk full, high traffic) and automatically switch to a less verbose logging mode (e.g., from full-packet to sampled).
The TitanLog architecture presents a fascinating alternative for the "Edge Collection" stage:
- Hierarchical Logging: Instead of treating all logs equally, it classifies traffic in real-time. Potentially malicious traffic gets full-packet logging, while benign traffic gets header-only logging. This dramatically reduces log volume from the start.
- Switch Offload: The classification logic is deployed onto a programmable network switch. This means the decision of what and how to log happens at line rate (100Gbps+) before the packet even hits a server CPU.
- CPU-Bypass with RDMA: The switch sends log data directly to the memory of a lightweight relay server using RDMA, completely bypassing the CPU on the receiving end. The CPU is only used later to batch-write the data from memory to disk.
This is an extremely efficient design that minimizes performance impact on the edge and pushes the boundaries of what's possible in high-speed data collection.
Conclusion
In this lesson, we architected a distributed logging pipeline capable of handling the massive scale of a global CDN. We saw how a multi-stage funnel architecture is essential for managing throughput and preventing bottlenecks.
Key Takeaways:
- Tiered Aggregation: A global logging pipeline is a funnel: agents on many edge nodes send to a smaller number of regional collectors, which then feed a central processing system.
- Buffering is Non-Negotiable: A durable message queue like Kafka is the critical "shock absorber" that decouples high-velocity producers from consumers, preventing data loss and system overload.
- Process in-stream: Stream processors like Flink allow for real-time normalization, enrichment, and aggregation of data before it lands in storage, making it more valuable and reducing storage costs.
- Purpose-Built Storage: There is no one-size-fits-all database. The best architecture uses multiple storage systems optimized for different access patterns: search indexes for interactivity, TSDBs for metrics, and columnar object storage for archival.
- Design for Failure: As the Cloudflare incident showed, systems fail in unexpected ways. Robust pipelines must have tested safeguards, handle backpressure, and make conscious trade-offs like fail-open vs. fail-close.
We have now designed systems to get policy data to the edge and telemetry data from the edge. The data flowing through our new logging pipeline, especially the aggregated metrics sent to our time-series database, is the perfect input for our next topic.
In the next lesson, we will design a metrics aggregation and real-time alerting system. We'll explore how to consume these metrics to build dashboards that provide visibility into the health of our platform and automatically trigger alerts when security threats or performance issues are detected.