Recommended resources
The freely available resources this lesson will direct you to.
- 14: Distributed Logging & Metrics Framework | Systems Design Interview Questions With Ex-Google SWEwww.youtube.com
- System Design: Metrics and Alarms Servicewww.youtube.com
- [PDF] Monitoring the distributed cloud: Metric collection and aggregationwww.eventiotic.com
- Distributed Metrics Logging & Aggregation - MockMe.ai | AI ...mockme.ai
Hello! Welcome to the fourth lesson in our module on architecting unified edge security platforms.
In our last lesson, we designed a high-throughput distributed logging pipeline to collect a massive stream of event data from our global edge network. We established a funnel that uses agents, Kafka, and Flink to collect, buffer, and process this data, routing it to specialized storage systems like Elasticsearch for search and a Time-Series Database (TSDB) for metrics.
That pipeline gives us the raw material. Now, we need to build the systems that turn that material into actionable intelligence. This brings us to today's learning outcome: Design a metrics aggregation and real-time alerting system that integrates data from distributed edge nodes.
We will architect the "nervous system" of our platform—the components that allow us to monitor the health of our global infrastructure, visualize performance and security trends on dashboards, and automatically trigger alerts when something goes wrong.
1. Framing the Problem: Requirements for a Global Metrics Platform
Before we design the components, let's formalize the requirements for a system that handles metrics from a distributed edge network. The scale and real-time nature of this environment impose stringent demands.
Distributed Metrics Logging & Aggregation
To start, let's review a comprehensive problem description for a distributed metrics and logging system. This will establish the functional and non-functional requirements that will guide our design.
Please read the first few sections of this article from MockMe.ai: 'The Question': This frames the overall goal. 'Clarifying Questions' and 'Requirements': Pay close attention to the distinction between functional requirements (ingestion, aggregation, APIs) and non-functional ones (high throughput, low latency for dashboards). 'Scale Estimates': Internalize the example numbers (100k events/sec, ~8.6 TB/day). This scale makes clear why a simple database solution would fail.
As the reading highlights, our system needs to be more than just a database. It's a full-fledged data platform with APIs for ingestion and querying, and it must provide low-latency aggregations to power real-time dashboards and, as we'll see, alerts.
2. The Metrics & Alerting Pipeline
The architecture for such a system builds directly upon the logging pipeline we designed in the last lesson. Let's look at a real-world example to see the components involved.
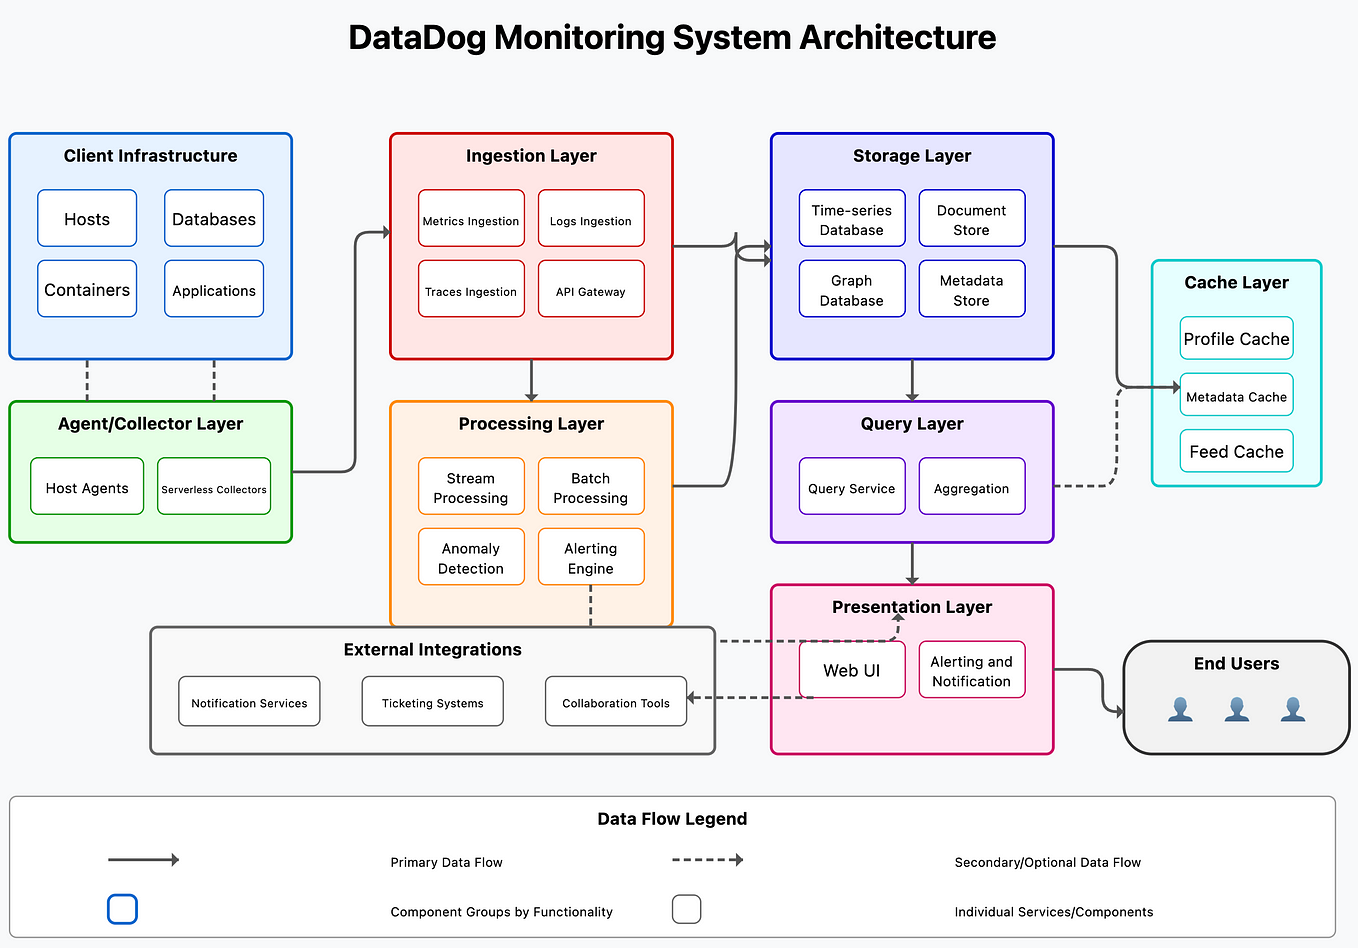
Our pipeline consists of several key stages:
- Collection & Ingestion: Handled by the logging pipeline from our previous lesson. Edge agents send data to a regional Kafka cluster.
- Stream Processing & Aggregation: A stream processor like Flink consumes the raw data stream.
- Storage: The processed metrics are stored in a Time-Series Database (TSDB).
- Querying: A query service provides an API for dashboards and other clients to retrieve data from the TSDB.
- Alerting: An alerting engine constantly evaluates rules against the metric data and triggers notifications.
We'll now dive deeper into the design of stages 2 through 5.
3. Real-Time Aggregation with Windowing
The raw data stream from our edge nodes might contain millions of individual events per second (e.g., request_served, firewall_block). Querying this raw data directly is inefficient. Instead, we aggregate it into time-series data points (e.g., requests_per_minute, blocks_per_second). This is done in our stream processing layer (Flink) using windowing.
14: Distributed Logging & Metrics Framework | Systems Design Interview Questions With Ex-Google SWE
Let's explore the fundamental techniques for aggregating time-series data. This video from the 'Jordan has no life' channel provides a clear explanation of different windowing strategies.
Please watch the section on 'Data Aggregation' (04:24 - 06:34). Focus on understanding the conceptual difference between the three main types of windows: Tumbling Windows: Fixed, non-overlapping time intervals (e.g., every 1 minute). Hopping Windows: Fixed-size intervals that overlap (e.g., a 5-minute window that advances every 1 minute). Sliding Windows: A window defined by the last N minutes of data from the current time.
For our metrics system, tumbling windows are the most common and efficient choice. For example, a Flink job can be configured to count the number of security events every 10 seconds. It would consume the raw event stream and output a new, much smaller stream of aggregated data points: {timestamp: 't0', metric: 'firewall_events', value: 1054}, {timestamp: 't0+10s', metric: 'firewall_events', value: 1210}, ....
This pre-aggregation is critical. It dramatically reduces the amount of data written to the TSDB and makes subsequent queries for dashboards and alerts much faster.
4. Designing the Query and Alerting Services
With our aggregated metrics flowing into a TSDB, we now need to build the services that consume this data. This involves two main components: a Query Service for dashboards and an Alarming Service for automated alerts.
System Design: Metrics and Alarms Service
The video 'System Design: Metrics and Alarms Service' from System Design Fight Club provides an excellent walkthrough of architecting these two critical services. The presenter designs them from first principles, which will align with your interests.
Please watch these two key sections: Query Service (32:41 - 37:24): Pay attention to how the query service acts as an intermediary between the browser (the dashboard) and the metrics data store (our TSDB). It fetches the data needed to render graphs. Alarming Service (54:36 - 1:01:35): This is the core of our alerting design. Focus on the flow: task runners pull data from the TSDB, send it to the 'Alarm Service' which uses a 'business rules engine' to check for violations, and then triggers a 'Notification Service'.
Let's break down the design discussed in the video.
The Query Service
- Purpose: Provides a stable, authenticated API endpoint for front-end applications (like a Grafana dashboard) to request time-series data.
- Function: It receives a query (e.g., "show me
firewall_eventsfor the last hour"), translates it into the specific query language of the underlying TSDB, fetches the data, and returns it in a standardized format. - Key Features:
- Abstraction: Hides the complexity and specific implementation of the TSDB.
- Caching: Can cache popular queries to reduce load on the database.
- Rate Limiting & Security: Enforces authentication and prevents abusive queries from overwhelming the system.
The Alarming Service
This is where the automated "reflex" of our system is built.

The architecture from the video follows this pattern and can be broken down into a loop:
-
Rule Scheduler & Data Fetcher: A set of scheduled tasks (like AWS Lambda functions or Kubernetes CronJobs) run at a regular interval (e.g., every minute). Each task is responsible for a set of alert rules. It queries the Query Service to fetch the metric data needed for its rules. This converts the "pull" from the database into a "push" to the alarm service.
-
Alarm Service & Rules Engine: This is the brain of the operation.
- It receives the metric data from the task runners.
- It feeds this data into a business rules engine. This is a specialized component for evaluating complex, configurable logic (e.g.,
(metric_A > T1 AND metric_B < T2) OR metric_C has been flat for 10 minutes). Using a dedicated rules engine (like Drools, or a cloud provider's service) is more flexible and scalable than hardcodingif/elsestatements in your application code. - The engine evaluates the rules and determines if an alert should be in a
FIRINGorOKstate.
-
State Management: An alert shouldn't fire the instant a threshold is crossed. To prevent "flapping" (rapidly changing between firing and ok), the Alarm Service maintains the state of each alert. A rule must be in violation for a configured duration (e.g., 5 consecutive minutes) before the alert state transitions to
FIRING. -
Notification Service: Once the Alarm Service declares an alert as
FIRING, it calls a separate Notification Service. This service is responsible for routing the alert to the correct destination(s) based on pre-configured policies. It integrates with various providers like PagerDuty, Slack, email (via SNS/SES), or webhooks. Decoupling this logic keeps the Alarm Service focused on evaluation.
5. Pattern for Distributed Systems: Decentralized Alerting
The model described above is a centralized one, where all alerts are evaluated in a central location. For a globally distributed edge network, we can leverage our architecture for even lower latency and higher resilience by decentralizing some of the alerting logic.
Monitoring the distributed cloud: Metric collection and aggregation
The research paper 'Monitoring the distributed cloud' proposes a hybrid architecture perfectly suited for our edge network. It advocates for moving some aggregation and alerting capabilities closer to the data source.
Please read these two sections: Section 4 ('Monitoring system architecture'): Focus on the roles of the 'metrics client' (on each node) and the 'metrics server' (in each region). Note how the regional metrics server is responsible not just for collection, but also for continuous aggregation and triggering local alerts. Section 5 ('Discussion'): This summarizes how the proposed architecture meets the requirements of a distributed system: scalability via decentralization, lightweight operation, and resilience.
This paper introduces a powerful design trade-off. We can implement a two-tiered alerting strategy:
-
Tier 1: Regional, Low-Latency Alerts: The "metrics servers" in our regional core datacenters (which run our Flink jobs and host regional TSDBs) can evaluate a subset of simple, critical rules. For example, if a single edge PoP within that region stops sending metrics, the regional server can detect this and trigger a local alert immediately. This is much faster than waiting for the data to be forwarded to a central system for evaluation.
-
Tier 2: Centralized, Global Alerts: The central alerting system we designed earlier is still necessary. It is responsible for evaluating complex rules that require a global view of the data, such as detecting a coordinated, low-and-slow DDoS attack happening across multiple geographic regions simultaneously.
This hybrid approach gives us the best of both worlds: the speed and resilience of decentralized execution for local issues, and the comprehensive global view of a centralized system for platform-wide issues.
Conclusion
In this lesson, we designed the core components of a metrics aggregation and real-time alerting system for our distributed edge network. We've built upon our logging pipeline to create a system that provides crucial visibility and automated responses.
Key Takeaways:
- Aggregation is Key: Real-time stream processing using windowing functions is essential to convert high-volume raw events into manageable time-series metrics.
- Decoupled Services: A robust alerting architecture consists of distinct, decoupled services: a Query Service for data access, a rule-driven Alarming Service for evaluation, and a Notification Service for dispatch.
- Rules as Code/Config: Using a dedicated business rules engine allows alerting logic to be flexible and configurable without requiring application redeployments.
- State Management Prevents Noise: Alerting systems must manage state over time (e.g.,
PENDING,FIRING) to prevent alert storms from transient, "flappy" conditions. - Centralized vs. Decentralized Trade-offs: For a distributed system, a hybrid model can be optimal. Evaluate simple, local alerts at the regional level for low latency, and evaluate complex, global alerts at a central location.
We now have systems for getting policy to the edge (Lesson 2), collecting data from the edge (Lesson 3), and now, observing the edge (Lesson 4). The next step is to look at the security of the connections themselves.
In the next lesson, we will design edge-to-origin security mechanisms. We'll focus on how to secure the "middle mile"—the connection from our edge servers back to our customers' origin servers—using techniques like mutual TLS, origin IP concealment, and connection pooling.