Recommended resources
The freely available resources this lesson will direct you to.
Hello! Welcome back to our course.
In our last lesson, we established a precise mathematical description of a feedforward neural network as a complex composite function, . This forward pass maps an input to a prediction through a series of nested affine transformations and nonlinearities.
This nested structure, while powerful, presents a challenge for training. To optimize the network's parameters ( and ) using gradient descent, we need to compute the partial derivative of a loss function with respect to every single parameter. Trying to apply the chain rule to that deeply nested equation by hand would be incredibly complex and error-prone, especially for deep networks.
Today's lesson introduces the elegant solution to this problem: the computational graph. We will learn to represent any mathematical expression, including our entire neural network, as a directed graph of elementary operations. This representation breaks down the monolithic composite function into a modular, structured format, which is the essential prerequisite for deriving the backpropagation algorithm.
Why Not Just Use Calculus on Paper?
Before we dive in, it's worth asking why we need a new data structure at all. You have a strong calculus background, so you know that, in principle, we could write out the full loss function and find the derivatives analytically. However, this approach has severe limitations.
This video from the Michigan Online course on Deep Learning provides an excellent motivation for why we need a more systematic approach than manual derivation.
Watch the segment from the beginning. The speaker highlights three key problems with deriving gradients on paper: it's tedious, infeasible for complex models, and not modular. Pay attention to the "modularity" point—in practice, you will want to swap loss functions or change architectures without having to re-derive everything from scratch.
The computational graph provides the modular and scalable framework we need.
Deconstructing Computation: A Simple Example
A computational graph is a directed acyclic graph (DAG) where nodes represent operations and edges represent the flow of data (which, in our case, will be tensors). The leaf nodes of the graph are the inputs to the function (e.g., our data x and parameters W, b), and the root node is the final output (e.g., the loss L).
Let's start with a very simple function: . We can decompose this into two primitive operations:
This decomposition can be visualized as a graph:
The process of feeding input values and calculating the output by moving left-to-right is called the forward pass. For example, if :
- The
+node receives -2 and 5, and outputs . - The
*node receives and , and outputs .
The real power of this representation comes from the backward pass, where we compute gradients. To find the derivative of the output f with respect to each input, we apply the chain rule while moving backward through the graph (from right-to-left).
Each node in the graph can be thought of as a self-contained unit that performs two jobs:
- Forward Pass: It receives inputs and computes a local output.
- Backward Pass: It receives the gradient of the final loss with respect to its own output (the "upstream gradient") and uses its own local derivative to compute the gradients with respect to its inputs (the "downstream gradients").
The same video provides a clear, step-by-step walkthrough of the forward and backward passes on this simple scalar example.
Watch the section from this timestamp. Focus on the distinction between the forward pass (computing values) and the backward pass (propagating gradients). The concepts of "upstream gradient", "local gradient", and "downstream gradient" are crucial. The key insight is that each node performs a purely local computation, oblivious to the overall graph structure.
From Scalars to Neural Networks
The same principles apply when our operations are on vectors and matrices. Let's see how to represent a single neuron, which computes a dot product, adds a bias, and applies an activation function.

Let's trace the forward pass:
- Inputs: We have inputs and , and learnable parameters (weights and bias) , , and .
- Dot Product: The graph computes and . These are then summed to get .
- Bias: The bias is added: . This is the pre-activation value, or logit.
- Activation: The sigmoid function is applied. This is decomposed into several steps: , , , and . The final output is .
This detailed graph perfectly illustrates how the high-level equation for a neuron is built from elementary operations.
A Formal Representation for a Network Layer
We can now formalize the representation for an entire network layer. A layer takes inputs (activations from the previous layer ) and parameters () to produce its output . The computation for a layer and the subsequent cross-entropy loss calculation can be broken down into a computational graph.
The following reading from Michael Collins' NLP course notes provides a clear and precise definition.
[PDF] Computational Graphs, and Backpropagation
This document provides a formal mathematical description of a feedforward network as a computational graph. It's exactly the kind of rigorous formulation that you prefer.
Please read Section 1.2.5, "A Single-Layer Feedforward Network as a Computational Graph". Focus on Figure 1.4, which lists all the components: Leaf variables: These are the inputs to the graph (data xi and parameters W, b, etc.). Non-leaf variables: These are the intermediate results of computations (z, h, etc.). Local functions: These are the operations performed at each node. Edges: These define the connections and flow of computation. Don't worry about the p(yi|xi; ...) probability formulation or the LOG-SOFTMAX for now; just see how the familiar layer computations (z = Wx_i+b and h=g(z)) are laid out as nodes in a graph.
Assembling the Full Network
With the layer as our building block, constructing the graph for a deep network is straightforward: we simply chain these layer-graphs together. The output of one layer's graph () becomes an input to the next layer's graph.
This results in a large graph where inputs, parameters, and intermediate activations are all nodes connected by elementary operations.
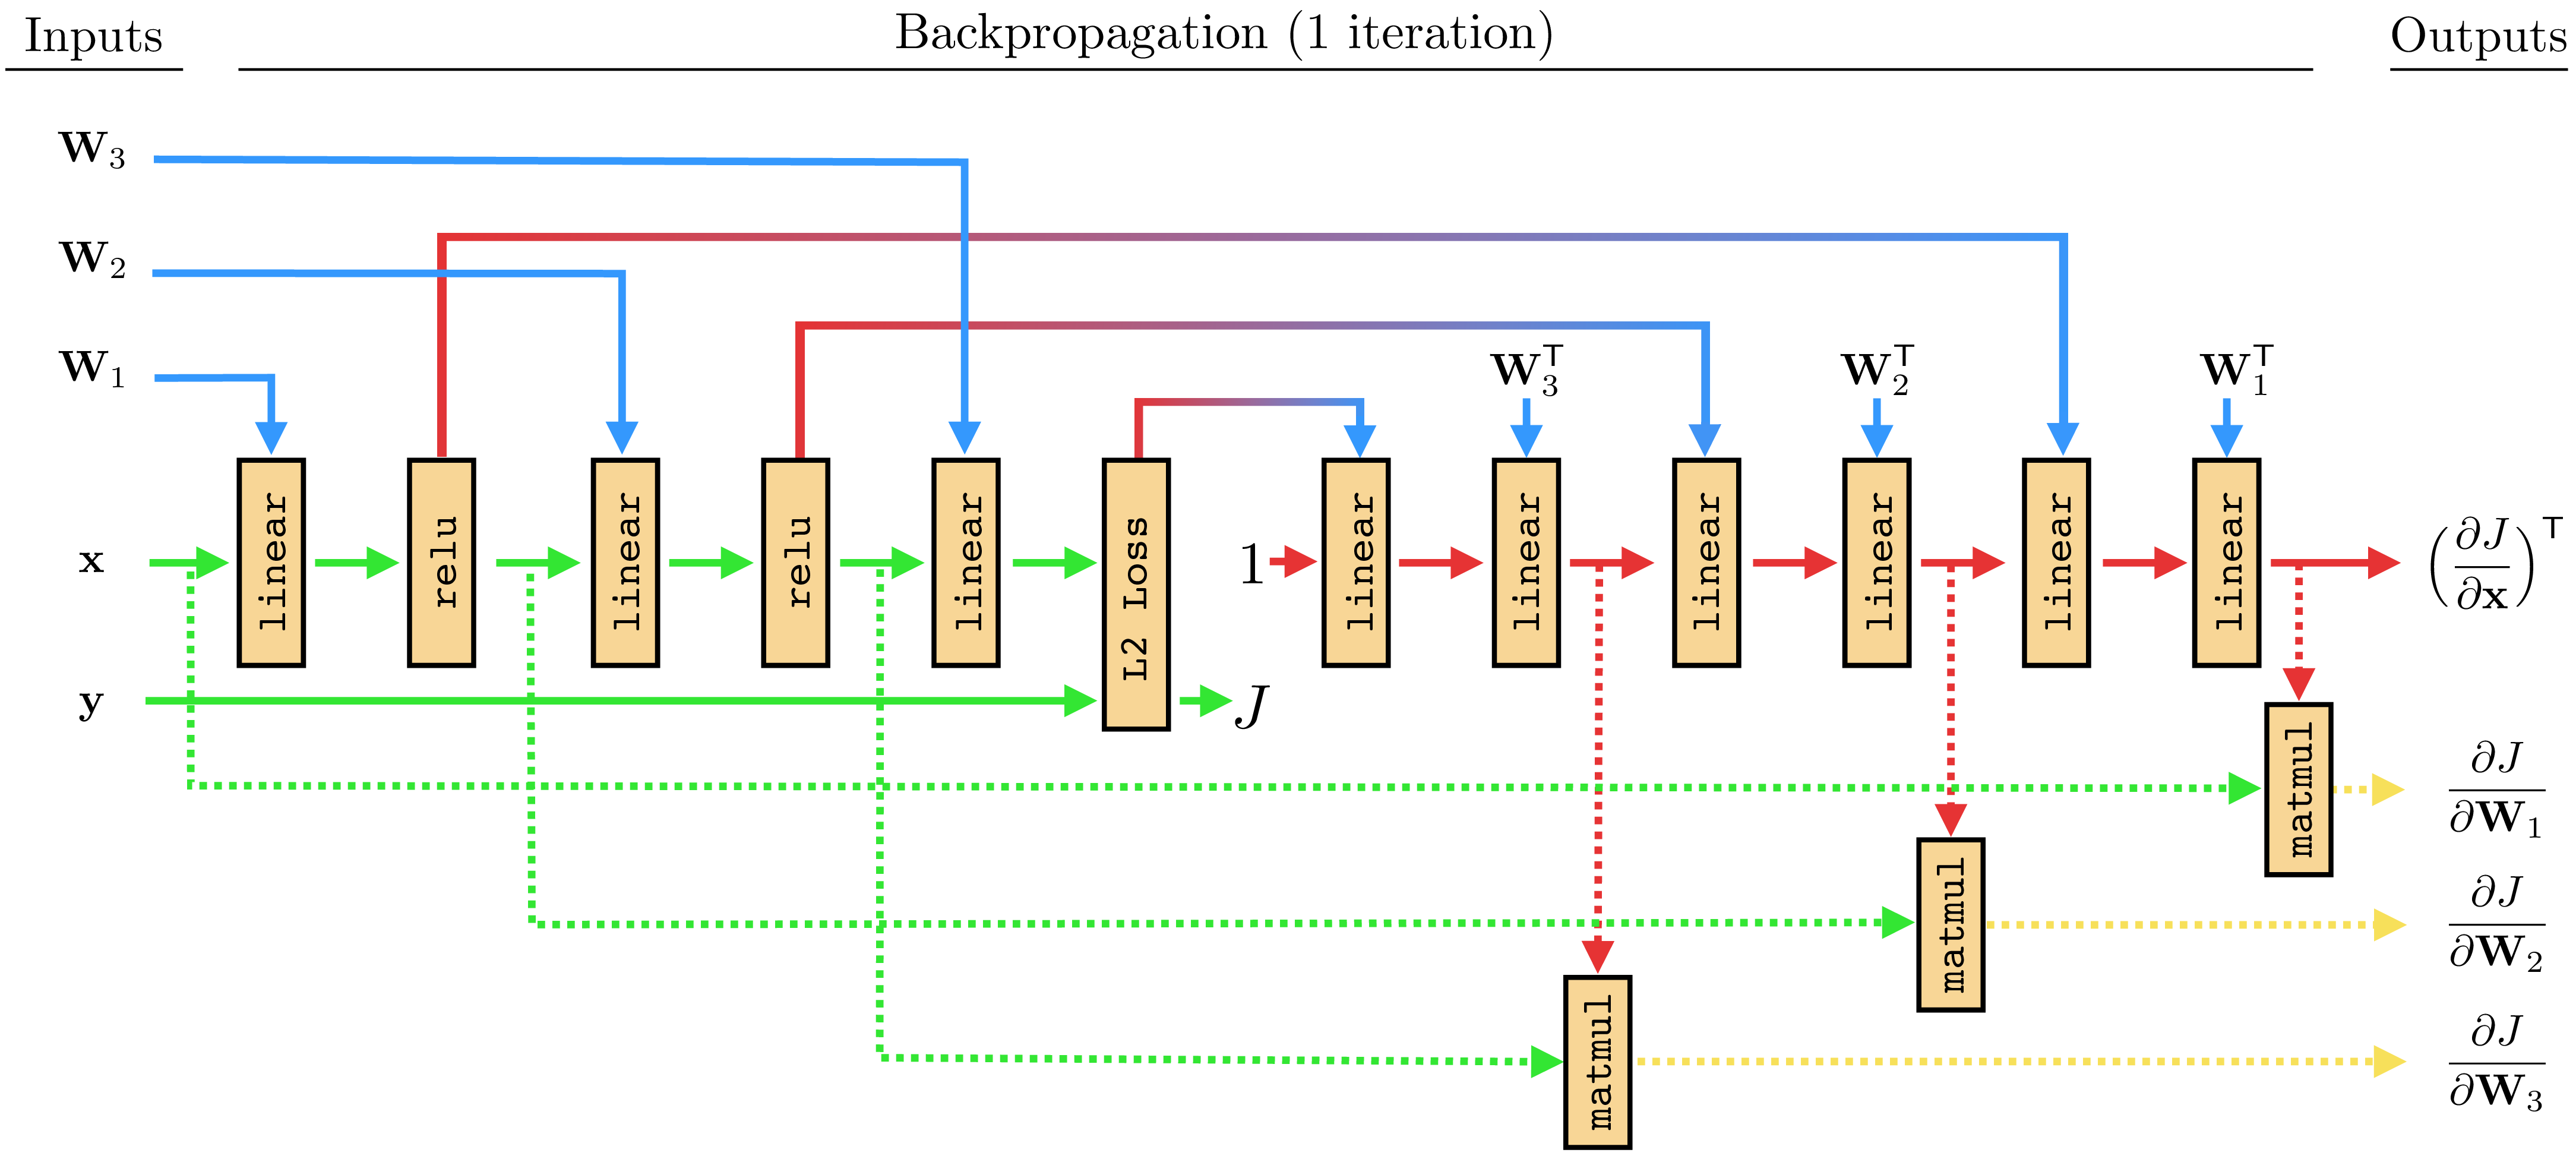
This diagram visualizes everything we've discussed.
- Forward Pass (left-to-right): The input
xand labelsyare leaf nodes on the left. The parametersW1, W2, W3are also leaf nodes. They "merge" at variouslinear(affine transformation) andrelu(activation) nodes. Finally, all paths converge at theL2 Lossnode, which computes the final scalar loss valueJ. - Backward Pass (right-to-left): This is a preview of our next lesson. The process starts from the loss
Jand propagates gradients backward through the graph. The goal is to calculate the derivatives ofJwith respect to the learnable parameters (∂J/∂W1,∂J/∂W2,∂J/∂W3), which are needed for the gradient descent update.
The structure of the graph is not always a simple chain. More complex architectures involve nodes that branch (sending their output to multiple subsequent nodes) and merge (taking inputs from multiple previous nodes). The branch operation is fundamental to how gradients are distributed, and it is how we handle concepts like parameter sharing.
This reading from the Foundations of Computer Vision book explains how general Directed Acyclic Graphs (DAGs) can be constructed using branch and merge operations.
Please read Section 14.7, "Backpropagation through DAGs" and Section 14.8, "Parameter Sharing". The key takeaways are: A branch operation copies an input to multiple paths. During backpropagation, the gradients from all paths are summed. A merge operation concatenates multiple inputs. During backpropagation, the incoming gradient is split among the original inputs. Parameter sharing (e.g., in an RNN) is simply a branch operation on a parameter node.
Conclusion
In this lesson, we have established a powerful and general way to represent neural networks. By deconstructing the complex, nested function of a network into a computational graph, we have created a structured, modular, and scalable representation.
Key Takeaways:
- A computational graph represents a mathematical function as a directed acyclic graph (DAG) of elementary operations (nodes) and data flow (edges).
- All components of a neural network—inputs, parameters, activations, and the loss—can be laid out in such a graph.
- The forward pass involves traversing the graph from the input leaves to the final loss node, computing the value of each node along the way.
- This graphical representation is not just a visualization tool; it provides the exact structure needed to systematically apply the chain rule to every parameter in the network. Each node only needs to know how to compute its local output and its local derivative.
We now have the complete blueprint for the forward pass. The next logical step is to traverse this blueprint in reverse to compute our gradients.
In the next lesson, we will do exactly that. We will derive the backpropagation algorithm by systematically applying the chain rule backward through the computational graph, starting from the final loss and efficiently calculating the gradient for every single parameter.