Hello! In our last lesson, we focused on the structural integrity of a single component, using hand calculations and FEA to verify its strength. We confirmed the part is unlikely to break under load. Now, we'll address an equally important question: will all the parts of your design fit together correctly, every single time they are manufactured?
Today's lesson addresses the learning outcome: Conduct a tolerance stack-up analysis for a critical assembly interface. This is a fundamental practice in mechanical design that bridges the gap between a perfect CAD model and the realities of manufacturing variation. You will learn how to identify dimensions that contribute to a critical fit, calculate the potential range of variation, and determine if your design will function as intended.
For an engineer, this skill is non-negotiable. It's how you prevent costly assembly line failures, ensure product performance, and make informed decisions about manufacturing costs versus design robustness. Documenting this analysis is a key part of the professional workflow you're aiming to build for your portfolio.
1. What is a Tolerance Stack-up?
Every dimension on an engineering drawing has a tolerance—a permissible range of variation. A tolerance stack-up is the cumulative effect of these variations on an assembly. Even if each individual part is within its specified tolerance, their combined variations can lead to a situation where the final assembly doesn't fit or function correctly.
The article below provides an excellent introduction to this concept and outlines a professional methodology for tackling it.
The Three Steps of Tolerance Analysis
To start, please read the first part of the article 'The Three Steps of Tolerance Analysis' from Simplexity Product Development. It introduces the core problem with a clear microscope fixture example.
Read from the beginning down to the end of the section 'A Tolerance “Stack”'. Focus on how the individual ±0.2 mm machining tolerances accumulate to create a much larger potential error (0.4 mm) in the final assembly. This will set the stage for why a formal analysis is necessary.
As you can see, simply ensuring individual part tolerances are met is not enough. We need a systematic way to analyze the entire "chain" of dimensions that affect a critical fit.
2. The Worst-Case Method: Ensuring 100% Fit
The most straightforward way to analyze a tolerance stack is the Worst-Case Method. This method assumes that every part in the assembly is at its least favorable tolerance limit, creating the maximum possible variation. While this scenario is statistically unlikely, this analysis guarantees that 100% of your manufactured parts will assemble correctly.
The core of the analysis is identifying the dimension loop (or tolerance chain)—the path of dimensions that connects one side of a critical gap to the other.
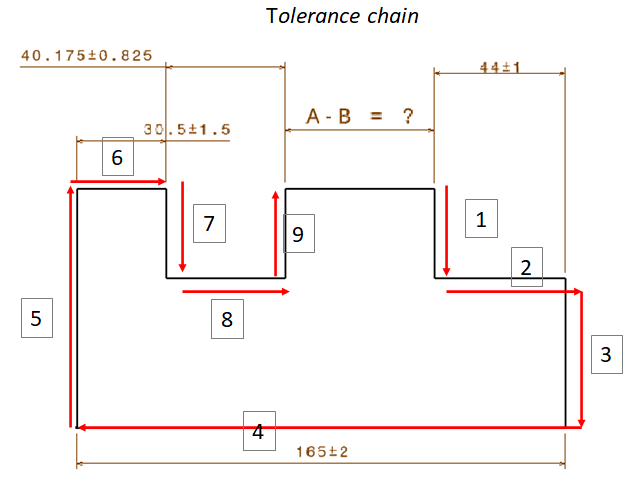
The following video provides a simple, practical demonstration of how to build this loop and perform the calculation.
Tolerance Stackup: Simple Assembly
This video, 'Tolerance Stackup: Simple Assembly,' clearly demonstrates the process of identifying a dimension loop and calculating the worst-case stack-up.
Please watch from the beginning up to 03:48. Pay close attention to: How the presenter establishes a path of dimensions to get from one side of the gap to the other. The key rule: nominal dimensions add or subtract based on direction, but tolerances always add in a worst-case analysis. This simple example perfectly illustrates the core mechanics of the calculation.
Steps for a Worst-Case Analysis:
- Identify the critical gap or interface you need to control.
- Establish the dimension loop. Start at one surface of the gap and trace a path through the dimensions of all contributing parts until you reach the other surface.
- Sum the nominal dimensions along the loop, assigning a positive sign for dimensions that increase the gap and a negative sign for those that decrease it. The sum should equal the nominal gap size.
- Sum the absolute values of all tolerances in the loop. This gives you the total worst-case variation.
- Calculate the limits:
- Maximum Gap = Nominal Gap + Total Tolerance
- Minimum Gap = Nominal Gap - Total Tolerance
If the minimum gap is negative, it means you have an "interference" condition, and the parts may not assemble.
The article below provides another clear, step-by-step example using a stack of disks.
Tolerance Stackup Analysis : Worst Case and RSS
Now, let's reinforce this with a textual example. This article, 'Tolerance Stackup Analysis : Worst Case and RSS,' provides a clear walkthrough of the worst-case method.
Read the section 'Worst Case Tolerance Analysis' and follow the disk stack-up example. Notice how it follows the exact steps we just outlined: summing nominals, summing tolerances, and then finding the upper and lower limits.
Test your understanding!
In the Simple Assembly video (resource LINK), the initial stack-up resulted in a gap of 0 ± 0.120". The presenter then changed the dimensioning scheme (from an overall dimension to a slot dimension), which reduced the variation to ± 0.080". Why did this happen without changing any individual tolerances?
Show answer
The original dimensioning scheme included five dimensions in the loop (three 1" blocks, the 4" overall dimension, and the 5" overall dimension). The tolerances of all five dimensions contributed to the stack. By re-dimensioning the part to directly control the 3" slot, the loop became shorter and only involved four dimensions (three 1" blocks and the 3" slot). This eliminated the tolerance from the 1" wall thickness and the 5" overall dimension from the critical stack-up, reducing the total variation. This demonstrates that how you dimension a part is as important as the tolerances themselves.
3. A More Realistic Approach: Statistical (RSS) Analysis
The worst-case method is safe, but it can lead to unnecessarily tight and expensive tolerances, because it's rare for all parts to be at their extreme dimensional limits simultaneously. For high-volume production, engineers often use a statistical approach.
The Root Sum of Squares (RSS) method assumes that part dimensions will vary according to a normal distribution (a bell curve) around the nominal. Instead of simply adding tolerances, it combines them statistically.
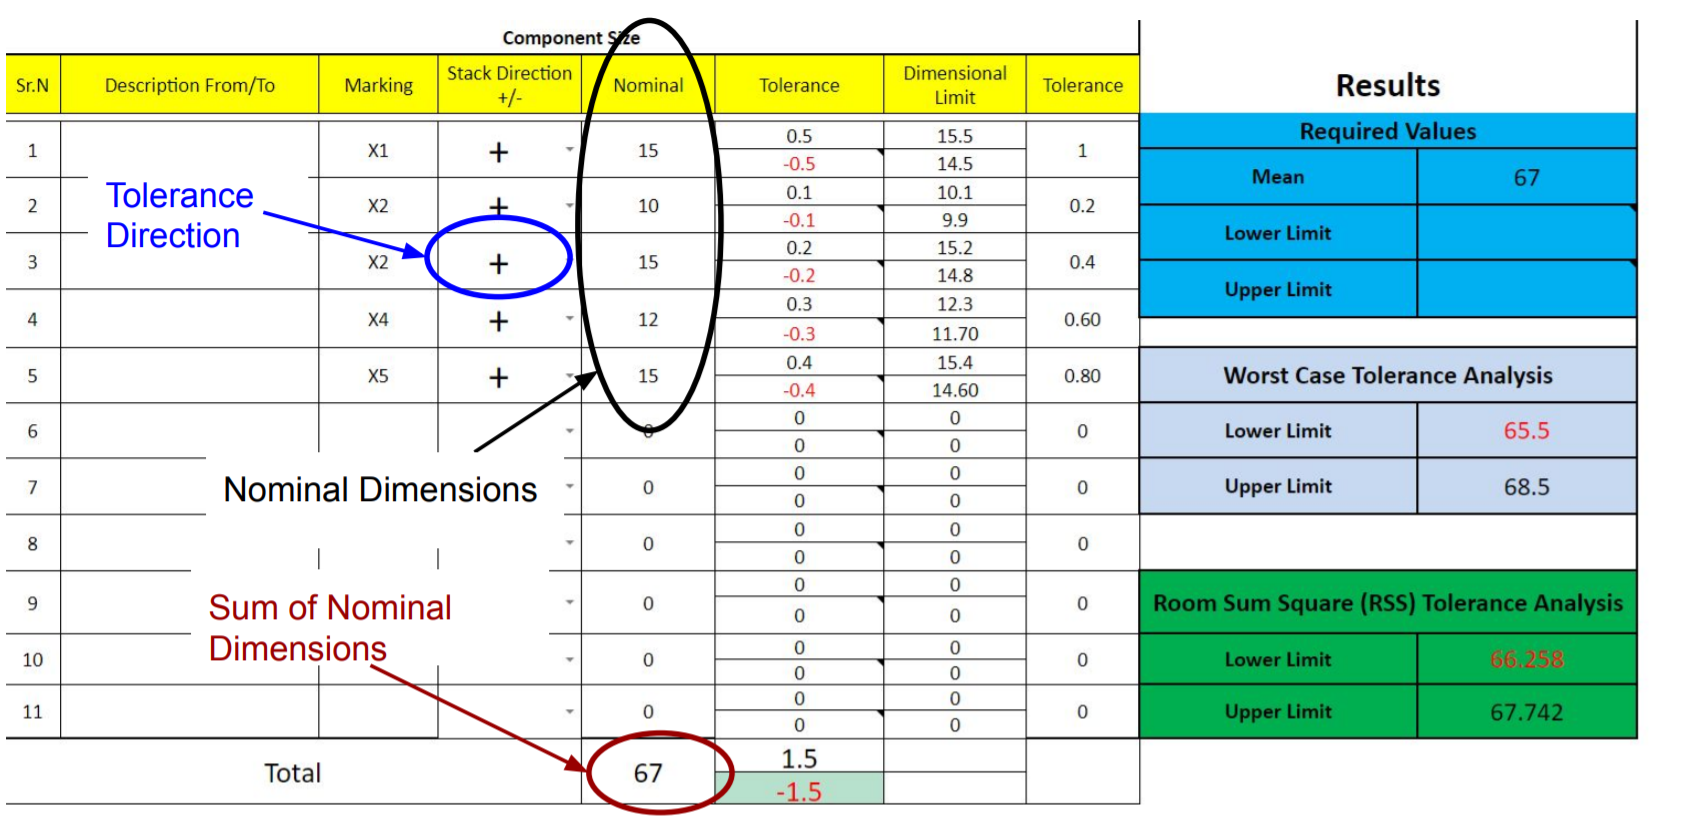
The RSS method results in a smaller predicted variation, which can allow you to loosen individual part tolerances, thereby reducing manufacturing costs. The trade-off is that there is a small statistical probability that some assemblies will fall outside the desired range.
Tolerance Stackup Analysis : Worst Case and RSS
Let's return to the 'Tolerance Stackup Analysis : Worst Case and RSS' article to see how the RSS method is calculated.
Read the sections 'Statistical Tolerance Analysis', 'Root Sum of Squares (RSS) Tolerance Stackup Analysis Example', and 'How worst case and RSS tolerance Analysis Results are Different?'. Focus on the core formula: the total variation is the square root of the sum of the squares of the individual tolerances. You don't need to memorize the standard deviation formulas for now, just grasp the concept that statistical analysis yields a tighter, more realistic assembly tolerance than the worst-case method.
When to Use Which Method:
- Worst-Case: Use for critical applications where 100% assembly is required, for low production volumes, or when safety is paramount.
- RSS (Statistical): Use for high-volume production where a small, predictable scrap rate is acceptable in exchange for lower part costs.
4. Your Turn: Analyze a Critical Interface
Now, let's apply this to your linear motion system project. A good tolerance analysis is best done in a spreadsheet.
Your Task (15 minutes):
-
Identify a Critical Interface: Examine your Onshape assembly for the linear actuator. A good candidate for analysis is the axial play (end float) of the lead screw. This is the small gap that allows the screw to shift back and forth slightly within its mounting blocks. Too much play can reduce positioning accuracy; too little (interference) can cause binding.
-
Sketch the Dimension Loop: Create a simple 1D sketch showing the parts and dimensions that determine this end play. The loop will likely involve:
- The length of the lead screw.
- The distance between the bearing pockets in the two end brackets.
- The thickness of any bearings or retaining rings.
-
Set up a Spreadsheet:
- Create a simple table with columns for: Part Name, Dimension Description, Nominal, and Tolerance (+/-).
- List each dimension from your loop.
- Estimate tolerances: You don't need final numbers yet. Use reasonable estimates. For a machined bracket, you might assume ±0.1mm. For a purchased lead screw, look up a typical tolerance from a supplier like McMaster-Carr or Misumi.
- Perform a Worst-Case Analysis: Calculate the nominal gap and the total worst-case tolerance. Determine the maximum and minimum end play for your lead screw.
Does your design have a guaranteed clearance? Or is there a risk of interference? This simple analysis provides a quantifiable answer.
Conclusion
You have now learned how to move beyond the perfect world of CAD and analyze the realities of manufacturing variation. This process is a critical part of a design engineer's due diligence. By systematically analyzing how tolerances accumulate, you can design assemblies that are robust, manufacturable, and cost-effective.
Key Takeaways:
- Tolerance analysis is essential to ensure parts fit and function correctly after manufacturing.
- The dimension loop is the fundamental tool for identifying all contributing dimensions for a critical fit.
- Worst-Case analysis (arithmetic sum of tolerances) guarantees a 100% fit but can lead to expensive, tight tolerances.
- Statistical (RSS) analysis provides a more realistic tolerance range for high-volume production, often allowing for cost savings.
- This analysis is a formal process, best documented in a spreadsheet for design reviews and record-keeping.
Preview of the Next Lesson:
This analysis has helped you identify the most critical dimensions that control your assembly's function. But how do you communicate this criticality on an engineering drawing? In our next lesson, we will begin to answer that by learning how to specify datums on engineering drawings to establish datum reference frames. This is the first step in using the powerful language of Geometric Dimensioning and Tolerancing (GD&T) to precisely control your design's geometry.