Hello! In our last lesson, you began translating your design concept into a full 3D assembly using a professional, top-down workflow. You now have the initial geometry of your mechanism, which is an excellent foundation for the next stage of engineering: analysis and validation.
Today, we will address the learning outcome: "Perform targeted hand calculations and FEA to validate critical components." This is a cornerstone of the design engineering process. You will learn to apply the "trust, but verify" principle to simulation, ensuring your design is not only conceptually sound but also structurally viable. We will identify a high-risk component in your design, analyze it using both classical engineering equations and modern FEA tools in Onshape, and then compare the results to validate your model.
This process is critical for building confidence in a design before committing to expensive prototypes or manufacturing, and it's a key skill to showcase in your portfolio.
1. The 'Why': Verification Before Validation
In your engineering studies and work, you've likely heard the phrase "Garbage in, Garbage out" applied to simulations. Finite Element Analysis (FEA) is an incredibly powerful tool, but it's only as reliable as the inputs and assumptions you provide. A real-world engineer never blindly trusts a colorful stress plot. They first verify their simulation against known principles.
This process is formally known as Verification and Validation (V&V).
- Verification: "Am I solving the equations right?" This involves checking that your computational model (the FEA setup) accurately reflects your mathematical model (the hand calculations).
- Validation: "Am I solving the right equations?" This involves comparing the simulation results to real-world experimental data.
For this lesson, we will focus on verification—using hand calculations to ensure our FEA setup is giving us a sensible answer.
The following article from XCEED Engineering provides an excellent overview of this professional practice.
FEA Verification: XCEED's Guide for Accurate Results
Please read this article, 'FEA Verification: XCEED's Guide for Accurate Results'. It clearly explains the professional rationale and process for verifying FEA results.
Read the article from the beginning down to the section 'Calculation Verification'. Pay close attention to: The definitions of Verification and Validation. The six steps of the verification process. The beam bending example, noting how they perform both a qualitative and quantitative assessment. This will provide the professional context for the rest of our lesson.
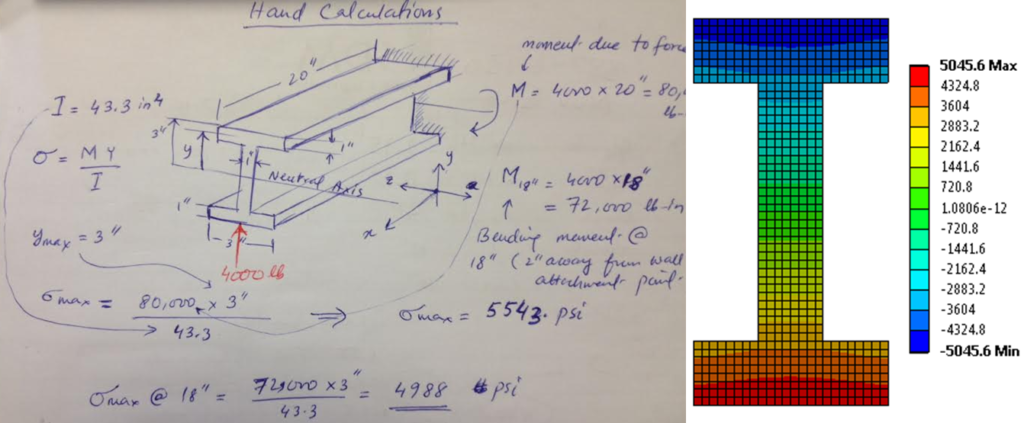
As the article demonstrates with the beam bending example, the goal is to create a simplified mathematical model that approximates the behavior of your component. You can then compare its results to the more detailed FEA. If the results are in the same ballpark, you can have much higher confidence in your simulation.
2. Identifying Critical Components and Performing Hand Calculations
Your first task is to examine the 3D assembly you created and identify a critical component. This is a part that is essential for the mechanism's function and is likely to experience significant stress or deflection. It might be a long bracket, a lever arm, or a pin carrying a heavy load.
Once you've chosen a component, the next step is to simplify its geometry and loading conditions to make a hand calculation feasible. For example, a complex mounting bracket might be simplified to a cantilever beam.
Given your mechanical engineering background, you are already familiar with the fundamental stress equation: . However, real parts have holes, fillets, and changes in cross-section that create stress concentrations. These are localized areas where stress is significantly higher than the nominal calculation would suggest.
A more refined hand calculation accounts for these using a stress concentration factor, K. The video below demonstrates this process, comparing the simple F/A approach to a K-factor calculation and an FEA result.
Stress Concentrations and Finite Element Analysis (FEA) | K Factors & Charts | SolidWorks Simulation
This video, 'Stress Concentrations and Finite Element Analysis (FEA),' excellently demonstrates the difference between nominal stress, stress concentration analysis, and FEA. Though it uses SolidWorks, the principles are universal.
Please watch two key segments: 00:00 - 03:47: This introduces the problem and shows the basic 'F/A' hand calculation for nominal stress. 35:46 - 43:30: This section explains how to use stress concentration factor (K) charts to get a much more accurate hand calculation. Observe how the geometric ratios (like r/d and D/d) are used to find the K value from the chart. Focus on the process of using the charts to refine a hand calculation.
Your Task: Part 1 - Hand Calculation (10 minutes)
- Identify: Look at your project assembly and choose one critical component to analyze.
- Simplify: Sketch a free-body diagram (FBD) of the component. Simplify its geometry (e.g., as a beam, plate, etc.) and define the loads and boundary conditions you expect it to see.
- Calculate: Perform a hand calculation for the maximum stress.
- Start with a simple formula (e.g., bending stress or axial stress ).
- If there are significant geometric discontinuities (holes, sharp corners), try to estimate a stress concentration factor (K) from a standard engineering textbook or online resource and calculate the peak stress .
3. Performing FEA in Onshape
Now that you have a theoretical estimate, you can use Onshape's built-in simulation tools to analyze the component's true, complex geometry. Onshape Simulation is designed to be an intuitive part of the design workflow. It leverages the mates in your assembly to automatically understand how parts are connected.
The official Onshape documentation provides a step-by-step guide to setting up a basic study.
This help document, 'Simulation,' is your reference guide for Onshape FEA. We'll focus on the basic workflow.
Review these three sections to understand the practical steps: 'Basic workflow: Create and simulate a load': This walks you through the core process of fixing a part, assigning material, applying a load, and running the study. 'Simulation load tools': Skim this to see the different types of loads you can apply (Force, Moment, Pressure, etc.). 'Simulation results and color scale': Read this to understand the different result plots available, especially von Mises stress, Safety factor, and Displacement.
Test your understanding!
You run a simulation and the Factor of Safety plot shows a minimum value of 0.8 in a high-stress area. What does this number tell you about the design?
Show answer
A Factor of Safety (FOS) less than 1.0 indicates that the calculated stress (von Mises stress) in that area has exceeded the material's yield strength. In this case, with an FOS of 0.8, the component is predicted to permanently deform (yield) under the applied load. The design is not sufficiently strong and needs to be revised.
Your Task: Part 2 - Onshape FEA (15 minutes)
Return to your Onshape assembly and follow these steps to set up your analysis on the component you chose.
- Isolate the Analysis: While you can run simulations on full assemblies, it's often easier to start with a single part or small sub-assembly. Ensure your critical part is in an assembly tab.
- Fix a Reference: Use a
Fastenedmate to fix a part of your assembly to the origin, or right-click a part and selectFix. This provides the "ground" that your loads will react against. - Assign Materials: Open the Bill of Materials (BOM) table or right-click the part in the Part Studio and assign a realistic material (e.g., "Steel 1020," "Aluminum 6061"). The material's yield strength is crucial for calculating the safety factor.
- Apply Loads: From the assembly toolbar, select a load type (e.g.,
Force). Apply the load to your critical part with the same magnitude and direction you used in your hand calculation. - Run and Interpret: Open the
Simulationpanel on the right. Check that your connections are correct and clickShow results.- Start by viewing the Displacement plot and animating it. Does the part deform in the way you expect? This is a fundamental sanity check.
- Switch to the von Mises stress plot. Where is the area of maximum stress? Does it align with where you predicted?
- Note the maximum stress value from the color bar legend.
4. Comparing Results: The Moment of Truth
You now have two numbers for the maximum stress: one from your hand calculation and one from the FEA. The final step is to compare them. Don't expect them to be identical! The hand calculation is an approximation, while the FEA accounts for the full geometry. However, they should be in the same order of magnitude.
- Qualitative Check: Does the location of max stress in the FEA match your intuition and FBD?
- Quantitative Check: Calculate the percent difference:
(|FEA_Stress - Hand_Calc_Stress| / Hand_Calc_Stress) * 100%. A difference of 5-20% is often considered good for initial verification, but this can vary. - Explain Discrepancies: If there's a large difference, why? Did your hand calculation neglect a significant stress riser that the FEA captured? Is the mesh in that area too coarse in the FEA? (As seen in the SolidWorks video, a finer mesh can be needed for sharp corners). This critical thinking is what separates a technician from an engineer.

Conclusion
Congratulations on completing a full verification loop! This is a process you will repeat countless times in your career. By grounding your advanced simulation work in fundamental engineering principles, you build robust, reliable products and demonstrate a high level of professional diligence.
Key Takeaways:
- Verification is essential: Always perform a "sanity check" on FEA results using hand calculations to avoid the "Garbage in, Garbage out" pitfall.
- Simplify for hand calculations: Abstracting complex geometry into simpler models (like beams) is a key skill for performing quick, effective analysis.
- Onshape's FEA workflow is integrated: Use the tools to apply loads, fix components, and visualize results like displacement, von Mises stress, and factor of safety.
- Compare and interpret: The goal is not to get identical numbers, but to confirm that both methods tell a similar story and to be able to explain any differences.
Preview of the Next Lesson:
We have now analyzed the strength of a critical component. Next, we will analyze its fit. We will shift our focus from stress to geometry and learn how to conduct a tolerance stack-up analysis for a critical assembly interface, ensuring that your design can be manufactured and assembled reliably.