Hello! Welcome back to our module on Detail Design and Tolerance Application.
In our last lesson, you learned how to identify the critical dimensions and interfaces in an assembly—the crucial first step in ensuring your design will function as intended. We introduced the concept of a "tolerance chain," which is the sequence of dimensions that collectively control a critical fit or gap.
Today, we're taking the next logical step. Now that we can identify the chain, we need to do the math. Your learning outcome is to perform a worst-case tolerance stack-up analysis for a critical assembly interface. This is a fundamental skill for any design engineer, as it allows you to predict, with 100% certainty, whether your parts will always fit together, no matter how the manufacturing variations fall.
1. The Principle of Worst-Case Analysis
In the real world, no part is ever perfect. Tolerances define the acceptable range of variation. A worst-case tolerance analysis is a conservative method that assumes the most unfavorable scenario: every part in your tolerance chain is manufactured at the extreme end of its tolerance zone, all conspiring to create the largest or smallest possible gap.
While this scenario might be statistically rare, designing for it is essential in many industries, especially for:
- Safety-critical systems where failure is not an option.
- Low-volume, high-cost assemblies where a single failed assembly is very expensive.
- Assemblies with very tight functional requirements.
The process is systematic and provides a definitive "go/no-go" answer for your design.
Tolerance Stack-Up Analysis Basics: A Complete How-To ...
The article "Tolerance Stack-Up Analysis Basics" from GD-Prototyping provides an excellent overview of this topic. We'll start by reading about the core methodology.
Please read the sections titled "The 'How-To': Performing a 1D Tolerance Stack-Up Analysis" and "Method 1: The Worst-Case Analysis." Focus on the five-step guide and the simple calculation: Total Variation (Worst-Case) = Σ (all individual tolerances). The worked example of the shaft and housing clearly demonstrates this principle.
As the article explains, the core idea is simple arithmetic. You identify the dimensional path and sum the tolerances. This gives you a guaranteed range for your critical dimension.
2. The Dimensional Loop Method
For any assembly beyond the most basic, we need a robust way to trace the dimensional path. This is often called the "dimensional loop" or "vector loop" method. The process involves:
- Starting at one side of the critical gap or feature you are analyzing.
- Creating a path of dimensions that "walks" you through the assembly part by part.
- Ending the path on the other side of the critical gap, thus closing the loop.
Dimensions that increase the gap are typically considered positive, and those that decrease it are negative.
The following video demonstrates this vector method. It uses an assembly with a pin and a hole, which introduces a bit more complexity than the simple block example.
Tolerance Stackup: Vector Method with GD&T
This video, "Tolerance Stackup: Vector Method with GD&T" by R. Dean Odell, does a great job of visualizing the dimensional loop. We'll focus on how the loop is constructed and calculated.
Please watch two key segments: From 3:42 to 7:15: This is the most important part. Observe how the presenter builds the dimensional loop, moving from one feature to the next across different parts. Pay attention to how he traces a path from the left side of the gap to the right side. From 13:12 to 14:15: Here, the presenter puts all the vectors into a table and calculates the result. Notice how he assigns a sign (positive or negative) to each dimension based on its direction in the loop. Note: The video mentions converting GD&T callouts into "half-vectors." We will cover GD&T in much more detail later in the course. For today, focus only on the concept of building the loop and summing the tolerances.
The key takeaway from the video is the systematic process of tracing a path and assigning a direction to each dimension. This ensures no contributing dimension is missed.
3. Assembling the Stack-Up in a Spreadsheet
In a professional setting, tolerance stack-ups are almost always documented in a spreadsheet. This makes the calculation clear, easy to review, and simple to update as the design evolves.
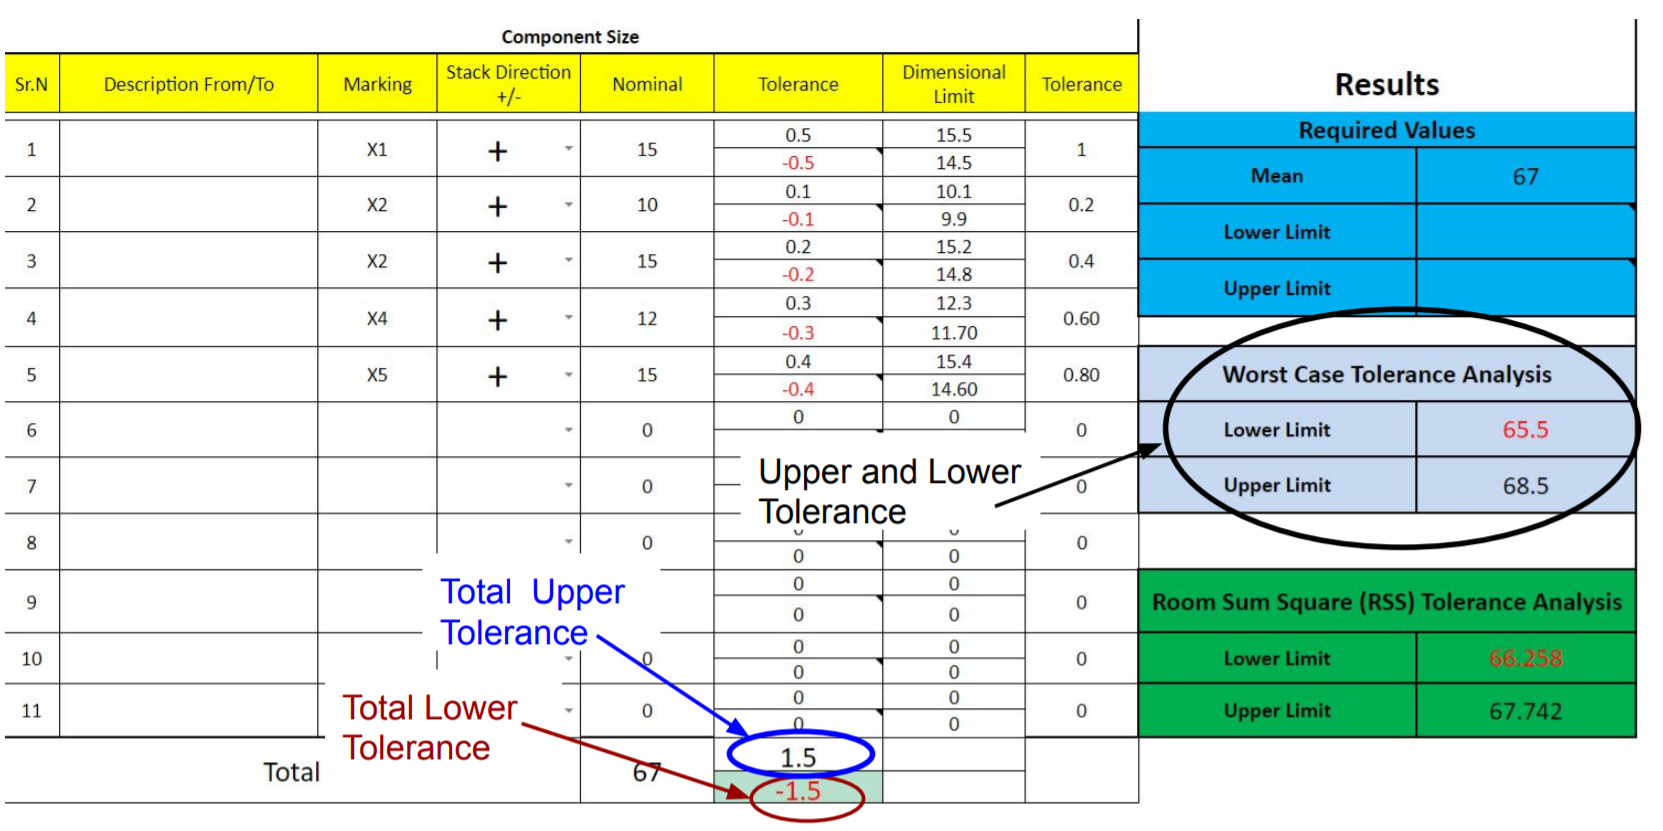
The article below walks through filling out such a spreadsheet for a simple microscope fixture. It also introduces an important real-world consideration: the clearance between mating parts (like a pin in a hole) also contributes to the stack-up.
The Three Steps of Tolerance Analysis
The article "The Three Steps of Tolerance Analysis" by Simplexity Product Development provides a practical guide to documenting your analysis.
Please read the section "Step 2: Stack – Fill out the Tolerance Stack." Focus on how each dimension in the chain is added as a line item in the spreadsheet. Pay close attention to how the analysis accounts for the misalignment possible due to the clearance between the mounting pin and the hole. This clearance effectively acts as another tolerance in your stack-up.
The calculation for the misalignment due to clearance is based on the size tolerances of the pin and the hole at their Least Material Condition (LMC), where the gap between them is largest. For a simple worst-case analysis, the maximum possible shift (radial) is:
Shift = (Max Hole Diameter - Min Pin Diameter) / 2
This shift value is then added to the stack-up just like any other tolerance.
Test your understanding!
Consider the simple assembly shown below. We want to calculate the worst-case range for the gap, Dim 5.
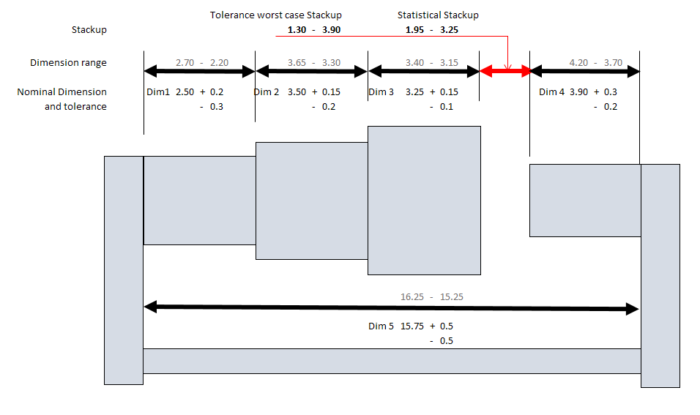
The dimensions are:
- Dim 1 =
50 ± 0.5 - Dim 2 =
10 ± 0.2 - Dim 3 =
20 ± 0.3 - Dim 4 =
15 ± 0.2
Set up the dimensional loop and calculate the nominal gap and the worst-case tolerance for Dim 5. What is the minimum and maximum possible gap?
Show answer
-
Dimensional Loop: To find the gap
Dim 5, we can define the loop as:Dim 5 = Dim 1 - Dim 2 - Dim 3 - Dim 4. -
Nominal Gap:
Nominal Dim 5 = 50 - 10 - 20 - 15 = 5 mm -
Worst-Case Tolerance: We sum the absolute values of all tolerances in the chain.
Total Tolerance = 0.5 + 0.2 + 0.3 + 0.2 = ±1.2 mm -
Resulting Range:
- Maximum Gap =
Nominal Gap + Total Tolerance=5 + 1.2 = 6.2 mm - Minimum Gap =
Nominal Gap - Total Tolerance=5 - 1.2 = 3.8 mm
- Maximum Gap =
So, the gap Dim 5 will always be between 3.8 mm and 6.2 mm.
Conclusion
You have now learned the fundamentals of performing a worst-case tolerance stack-up, a cornerstone of robust mechanical design. This analytical tool moves you from hoping parts will fit to knowing they will.
Key Takeaways:
- Worst-case analysis assumes all parts are at their dimensional limits to find the maximum possible variation in an assembly.
- The dimensional loop method provides a systematic way to trace the path of all contributing dimensions.
- The calculation is a simple sum of the absolute values of all tolerances in the loop, including any variation from clearances between parts.
- Documenting the analysis in a spreadsheet is standard industry practice for clarity and review.
Preview of the Next Lesson:
Worst-case analysis often reveals that simple +/- tolerances need to be very tight (and thus expensive to manufacture) to meet functional requirements. This pushes us toward a more powerful and descriptive language for defining geometry and variation.
In the next lesson, you will begin your journey into Geometric Dimensioning and Tolerancing (GD&T) by learning how to specify datums on engineering drawings to establish datum reference frames. Datums are the foundation of GD&T, providing a stable and functional reference system from which all critical features are defined and inspected.