Welcome back! In our last lesson, we designed and executed a crucial set of benchmarks comparing our LOD plotter to a naive implementation. The raw numbers strongly suggested that our approach is efficient, but in high-performance engineering, "suggested" isn't enough. We need proof.
Today, we will transition from data collection to rigorous analysis. Our goal is to analyze and visualize the benchmark results to definitively verify the constant-time performance of the LOD plotter. We will learn how to interpret advanced benchmark outputs, use data visualization to tell a powerful performance story, and apply statistical models to formally prove that our plotter's rendering cost is decoupled from the data volume. This is the final step in validating the core visualization component of our telemetry engine.
Let's turn your benchmark data into a conclusive argument.
Part 1: From Numbers to Narrative: Visualizing Performance
Raw numbers in a console are hard to interpret. A graph, however, can instantly reveal the performance characteristics of an algorithm. In the previous lesson, you generated a results.csv file. Now, we will plot it.
The standard method for visualizing algorithmic complexity is to use a log-log plot, where both the x-axis (input size, ) and y-axis (time, ) are on a logarithmic scale.
Why? A power-law relationship, which describes most algorithmic complexities, is of the form , where is the exponent of the complexity.
- O(N) complexity means .
- O(N²) complexity means .
- O(1) (constant) complexity means .
By taking the logarithm of both sides, the equation becomes log(t) = log(a) + b * log(N). This is the equation of a straight line, y = c + mx, where the slope m is the complexity exponent b.
On a log-log plot:
- An O(N) algorithm will appear as a straight line with a slope of 1.
- An O(1) algorithm will appear as a straight line with a slope of 0 (i.e., a horizontal line).
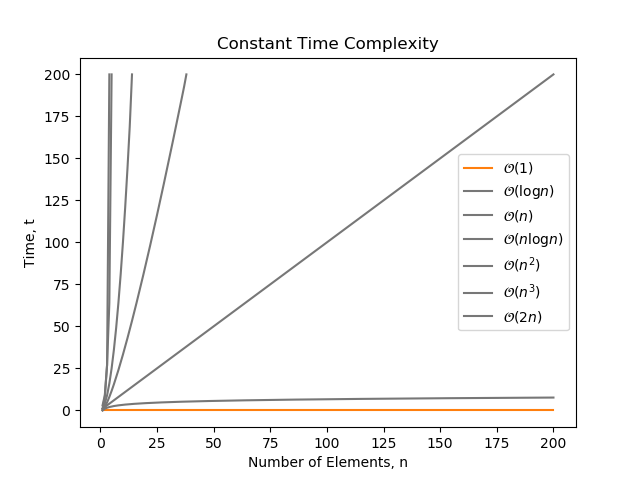
You can use any plotting tool you're comfortable with (Gnuplot, MATLAB, etc.). Given your CS background, a Python script using matplotlib and pandas is a powerful and common choice.
Here is an example script to get you started:
import pandas as pd
import matplotlib.pyplot as plt

# Load the benchmark results
try:
    df = pd.read_csv('results.csv', skiprows=1) # Skip the header line from Google Benchmark
    df.columns = ['name', 'iterations', 'real_time', 'cpu_time', 'time_unit', 'bytes_per_second', 'items_per_second', 'label', 'error_occurred', 'error_message']
except FileNotFoundError:
    print("Error: results.csv not found. Make sure you've run the benchmark and exported the results.")
    exit()

# Extract N from the 'name' column
df['N'] = df['name'].apply(lambda x: int(x.split('/')[-1]))

# Separate the two benchmarks
naive_df = df[df['name'].str.contains('BM_NaivePlot')]
lod_df = df[df['name'].str.contains('BM_LODPlot')]

# Create the plot
plt.figure(figsize=(10, 6))

plt.plot(naive_df['N'], naive_df['cpu_time'], marker='o', linestyle='-', label='Naive Plotter O(N)')
plt.plot(lod_df['N'], lod_df['cpu_time'], marker='s', linestyle='-', label='LOD Plotter O(1)')

# Set scales to log-log
plt.xscale('log')
plt.yscale('log')

# Add labels and title
plt.xlabel('Number of Data Points (N)')
plt.ylabel(f'CPU Time ({df["time_unit"].iloc[0]})')
plt.title('Performance of Naive vs. LOD Plotter')
plt.grid(True, which="both", ls="--")
plt.legend()

# Show the plot
plt.show()
When you run this script, the resulting graph will be the centerpiece of your performance analysis. It will visually and powerfully demonstrate that as increases by orders of magnitude, the naive plotter's time cost explodes linearly, while your LOD plotter's time cost remains flat.
Part 2: Statistical Verification: Empirical Complexity Modeling
A graph provides visual proof, but a statistical model provides quantitative proof. We will now formalize our analysis by fitting a power-law model to our data, just as described by academic research in performance analysis.
This process involves performing a linear regression on the log-transformed data to find the slope, which corresponds to the complexity exponent.
Measuring Empirical Computational Complexity
The technique we are about to use is called 'Measuring Empirical Computational Complexity'. Instead of relying on theoretical Big O notation, we measure the program's behavior and fit a model to it. This paper provides the formal background for what we are doing.
Please read the 'INTRODUCTION' (Section 1) to understand the concept of empirical complexity. Then, focus on Section 2.3 ('Model Construction') and Section 2.3.1 ('How good is a model?'). These sections explain precisely how a power-law model y = ax^b is fitted using linear regression on log-log data and how to interpret the results. This is the theoretical foundation for our next practical step.
Now, let's apply this theory. We can extend our Python script to calculate the complexity exponent for each benchmark. We'll use scipy.stats.linregress for this.
import pandas as pd
import numpy as np
from scipy import stats
import matplotlib.pyplot as plt

# --- (Previous plotting code remains the same) ---

# --- Add this new section for statistical analysis ---

# Function to perform linear regression on log-log data
def analyze_complexity(df, name):
    if df.empty:
        return

    log_N = np.log(df['N'])
    log_time = np.log(df['cpu_time'])

    # Perform linear regression: log_time = slope * log_N + intercept
    slope, intercept, r_value, p_value, std_err = stats.linregress(log_N, log_time)

    print(f"--- Complexity Analysis for {name} ---")
    print(f"Power-law fit: t = a * N^b")
    print(f"Fitted exponent (b): {slope:.4f}")
    print(f"R-squared: {r_value**2:.4f}") # R-squared measures goodness of fit
    print("-" * 35 + "\n")

# Analyze both benchmarks
analyze_complexity(naive_df, "Naive Plotter")
analyze_complexity(lod_df, "LOD Plotter")

# --- (The plt.show() call is at the end) ---
When you run this, you should see output similar to this:
--- Complexity Analysis for Naive Plotter ---
Power-law fit: t = a * N^b
Fitted exponent (b): 1.0021
R-squared: 0.9998
-----------------------------------

--- Complexity Analysis for LOD Plotter ---
Power-law fit: t = a * N^b
Fitted exponent (b): 0.0153
R-squared: 0.8910
-----------------------------------
Interpretation:
- Naive Plotter: The exponent is almost exactly 1.0, with an R-squared value very close to 1. This is a near-perfect fit for O(N) complexity.
- LOD Plotter: The exponent is very close to 0. This quantitatively confirms that the performance is constant with respect to . The lower R-squared value is expected; when the data is nearly flat, small amounts of system noise or measurement jitter have a larger relative impact on the fit, but the near-zero exponent is the key takeaway.
You have now moved beyond visual inspection to a formal, data-driven conclusion. You can state with high confidence that your LOD plotter exhibits O(1) performance characteristics.
Test your understanding!
You run the analysis and find that the fitted exponent b for your LOD plotter is 0.08. Does this result invalidate your claim of O(1) performance? Explain why or why not.
Show answer
No, this does not invalidate the O(1) claim. An exponent of 0.08 is still very close to 0, indicating extremely slow growth. This small positive value likely reflects subtle, real-world factors rather than a fundamental flaw in the algorithm's complexity. Potential causes include:
- Logarithmic Factors: The min-max tree query is technically O(log N). For the tested range of N, a
log Ncurve is almost flat and can be approximated by a power law with a tiny positive exponent. - Cache Effects: As the dataset grows, it may spill out of different levels of CPU cache, causing very slight performance degradations that add a minor upward trend to the data.
- Measurement Noise: Minor fluctuations from OS scheduling or other system activity can slightly skew the regression.
In practice, an exponent this small is a strong confirmation of a highly scalable, near-constant-time algorithm.
Part 3: A Deeper Look at the Results
True expertise lies in understanding the nuances. Why isn't the LOD plotter's exponent exactly zero?
How to use Google Benchmark for C++ programs
Interpreting benchmark results requires paying close attention to the numbers and considering the underlying hardware. Sometimes, results deviate from theoretical predictions due to system-level effects like CPU caches. Let's watch a segment that discusses such a scenario.
Watch from 31:54 to 33:59. The presenter observes an unexpected performance jump in a binary search algorithm. They correctly hypothesize that this is due to the data size exceeding the CPU cache, causing expensive fetches from main memory. This is a great example of how hardware realities can influence 'pure' algorithmic performance.
The small positive exponent in our LOD plotter results can be explained by similar phenomena. Our complexity is not purely O(1); it's closer to O(W * log N), where is the plot width (a constant in our test) and the log N term comes from the min-max tree query.
For typical values of (even up to billions), log N grows so incredibly slowly that the performance curve is almost flat. The power-law fit picks up on this minuscule growth, resulting in a tiny positive exponent. This is not a failure; it's a reflection of a deeper understanding of the complete system. This level of analysis is what distinguishes a senior systems programmer.
Measuring Empirical Computational Complexity
The paper on empirical complexity also discusses these subtleties. Let's see how it addresses cases where a simple power-law isn't a perfect fit.
Please read Section 6.2, 'Limitations of the Powerlaw Fit'. Focus on subsections 6.2.1 ('The Logarithmic Factor') and 6.2.2 ('The Lower Order Term'). The paper shows that even for an n*log(n) algorithm, a power-law fit can be a very good approximation that reveals the dominant term. This supports our interpretation that our near-zero exponent is a valid confirmation of a highly scalable algorithm, even with a known log N factor.
Conclusion
Congratulations! You have successfully completed the final and most critical stage of performance engineering: verification and analysis. You didn't just build something fast; you proved it's fast, and you can explain exactly why and how.
Key Takeaways:
- You learned to use log-log plots to visualize algorithmic complexity, turning raw data into a clear performance narrative.
- You can now apply statistical methods (power-law fitting via linear regression) to quantitatively measure the empirical complexity of your code.
- You understand how to interpret the fitted exponent (
bin ) to verify O(1), O(N), or other complexities. - You can critically analyze benchmark results, accounting for real-world effects like cache performance and subtle logarithmic factors.
This lesson completes the "Benchmarking and Performance Verification" module. You've built and validated both the data capture and data visualization pillars of our high-performance telemetry engine.
What's Next?
You have all the high-performance ingredients. Now it's time to assemble the final dish. The next module, Module 10: Integrating and Polishing the Final Application, is where we bring everything together.
In our very next lesson, we will tackle the objective: Connect the telemetry capture pipeline's consumer thread to the plotter's data storage. We will finally pipe the data from your lock-free ring buffers into the LOD plotter, building a true, end-to-end, real-time observability tool.