Welcome back! In our last two lessons, we designed and executed benchmarks to quantify the "observer effect" of our instrumentation system, proving we can achieve true zero-overhead when profiling is disabled. This rigorous approach to performance measurement is fundamental to building high-performance systems.
Today, we'll apply these skills to answer the most critical question for our project's visualizer: is our LOD Plotter actually fast?
Our learning outcome is to design and execute a benchmark to measure plot rendering time against exponentially increasing data volumes. We will put our min-max tree implementation to the ultimate test, comparing it against a naive approach to empirically prove that our data-oriented design delivers on its promise of constant-time rendering, regardless of how much data we throw at it.
This lesson is the culmination of your work on the plotter. Let's get the data to prove its worth.
Part 1: The Benchmark Strategy: Naive vs. LOD
To appreciate the performance of our Level-of-Detail (LOD) plotter, we need a baseline for comparison. We will benchmark two distinct approaches:
-
The Naive Plotter: This is the most straightforward method. To render the plot, it iterates through every single data point and draws a line segment to the next point. The computational cost is directly proportional to the number of data points, . We expect its performance to be O(N).
-
The LOD Plotter: This is the sophisticated system you built. It uses a min-max tree to find the minimum and maximum values within each vertical pixel column of the plot. It then draws a single vertical line per column. The cost is determined by the plot's width in pixels, , and the tree query time. For large datasets, the rendering time should be independent of , approaching O(W).
Our goal is to write a benchmark that measures the rendering time of both plotters as we increase exponentially (e.g., 1,000, 10,000, 100,000, 1,000,000 points) and observe this performance difference.
Part 2: Handling UI Benchmarks with Fixtures
Benchmarking a GUI component is more complex than a simple function because it depends on an existing context (a window, a graphics API, an ImGui instance). We can't just call plotter.Draw() in a loop.
To solve this, we will use Google Benchmark Fixtures. A fixture is a class that allows us to perform setup and teardown operations for our benchmarks.
SetUp(state): This method runs once before the timing loop of each benchmark run. We'll use it to generate our test data and, for the LOD plotter, build the min-max tree. This ensures preparation costs are not included in our measurement.TearDown(state): This runs after the benchmark. We'll use it to clean up allocated data.
This approach lets us cleanly separate the one-time setup cost from the per-frame rendering cost we actually want to measure.
Part 3: Implementing the Benchmarks
Let's create a new file, plotter_benchmark.cpp. Since we are benchmarking ImGui draw commands, we'll need to include the necessary ImGui headers. For this benchmark, we can work with a "mock" ImDrawList so we don't need a full windowing system running, simplifying the setup.
First, let's define our benchmark fixture. It will hold the data points that both plotters will use.
#include <benchmark/benchmark.h>
#include <vector>
#include <cmath>
#include <numeric>

// Forward declare your MinMaxTree and LODPlotter classes
// For example:
// #include "MinMaxTree.h"
// #include "LODPlotter.h"

// For this example, we'll use mock ImGui types.
// In your actual project, include "imgui.h".
struct ImVec2 { float x, y; };
struct ImU32 { };
struct ImDrawList {
    void AddLine(const ImVec2& p1, const ImVec2& p2, ImU32 col, float thickness = 1.0f) {
        // Mock function: In a real run, this would add to a command buffer.
        // We use DoNotOptimize to prevent the calls from being removed.
        benchmark::DoNotOptimize(p1);
        benchmark::DoNotOptimize(p2);
    }
    void AddRectFilled(const ImVec2& p_min, const ImVec2& p_max, ImU32 col) {
        benchmark::DoNotOptimize(p_min);
        benchmark::DoNotOptimize(p_max);
    }
};

// Our fixture for holding test data
class PlotterBenchmark : public benchmark::Fixture {
public:
    std::vector<float> data;
    // std::unique_ptr<MinMaxTree> tree; // For the LOD plotter

    void SetUp(const ::benchmark::State& state) override {
        size_t n = state.range(0);
        if (data.size() != n) {
            data.resize(n);
            // Generate some sample data, like a sine wave
            for(size_t i = 0; i < n; ++i) {
                data[i] = sin(i * 0.01f);
            }
        }

        // If benchmarking the LOD plotter, you would build the tree here
        // tree = std::make_unique<MinMaxTree>(data);
    }

    void TearDown(const ::benchmark::State& state) override {
        // data is cleaned up automatically by vector's destructor
    }
};
The Naive Plotter Benchmark
Now, let's write the benchmark for the naive plotter. It will use the fixture and iterate through all the data points in the timing loop.
BENCHMARK_F(PlotterBenchmark, BM_NaivePlot)(benchmark::State& state) {
    ImDrawList drawList;
    const float plot_width = 800.0f;
    const float plot_height = 200.0f;

    for (auto _ : state) {
        for (size_t i = 0; i < data.size() - 1; ++i) {
            ImVec2 p1 = { (float)i / data.size() * plot_width, data[i] * plot_height / 2.0f + plot_height / 2.0f };
            ImVec2 p2 = { (float)(i + 1) / data.size() * plot_width, data[i + 1] * plot_height / 2.0f + plot_height / 2.0f };
            drawList.AddLine(p1, p2, ImU32{});
        }
    }
    state.SetComplexityN(state.range(0));
}
The LOD Plotter Benchmark
Next, we benchmark our LOD plotter. The setup is similar, but the work inside the loop is different. It will call your LODPlotter::Draw method, which queries the min-max tree and draws a fixed number of vertical bars.
Note: For the code below to work, you'll need to adapt it to your actual LODPlotter and MinMaxTree class implementations from Modules 8 and 9. The code assumes your plotter has a method that takes a draw list and performs the rendering.
BENCHMARK_F(PlotterBenchmark, BM_LODPlot)(benchmark::State& state) {
    // In SetUp, the min-max tree for 'data' would have been built.
    // Assuming you have an LODPlotter class that holds the tree.
    // LODPlotter my_plotter(tree);

    ImDrawList drawList;
    const float plot_width = 800.0f;

    for (auto _ : state) {
        // This is a simplified representation of your plotter's Draw call.
        // It would iterate from 0 to plot_width pixels.
        for (int x = 0; x < (int)plot_width; ++x) {
            // 1. Calculate data range for this pixel column
            // size_t i_start = (x / plot_width) * data.size();
            // size_t i_end = ((x + 1) / plot_width) * data.size();

            // 2. Query the min-max tree for that range
            // MinMaxResult mm = tree->query(i_start, i_end);

            // 3. Draw one vertical line representing the min/max range
            // ImVec2 p_min = { (float)x, mm.min * ... };
            // ImVec2 p_max = { (float)x, mm.max * ... };
            // drawList.AddRectFilled(p_min, p_max, ImU32{});
        }
        // To make this runnable, we add a placeholder loop.
        // Replace this with your actual plotter's draw logic.
        for (int x = 0; x < (int)plot_width; ++x) {
            benchmark::DoNotOptimize(x);
        }
    }
    state.SetComplexityN(state.range(0));
}
Finally, we register both benchmarks to run with an exponentially increasing number of points.
// From 1,024 to over 1 million points
BENCHMARK_REGISTER_F(PlotterBenchmark, BM_NaivePlot)
    ->RangeMultiplier(8)->Range(1<<10, 1<<20)
    ->Complexity(benchmark::oN);

BENCHMARK_REGISTER_F(PlotterBenchmark, BM_LODPlot)
    ->RangeMultiplier(8)->Range(1<<10, 1<<20)
    ->Complexity(benchmark::oN); // We provide oN so BM can show us the fitted curve

BENCHMARK_MAIN();
To learn how to use RangeMultiplier and Range to sweep across different input sizes, the following resource is a great guide.
How to use Google Benchmark for C++ programs
To test our plotters against exponentially increasing data volumes, we'll use Google Benchmark's Range and RangeMultiplier functions. Let's quickly review how they work.
Watch the segment from 12:01 to 14:10. The presenter shows how to sweep a parameter across multiple values. We will use RangeMultiplier(8)->Range(1<<10, 1<<20) to test sizes from 1024 up to 1,048,576, multiplying the size by 8 at each step.
Part 4: Executing and Analyzing the Results
Compile and run the benchmark. The output will be the moment of truth. You should see something like this (exact times will vary):
--------------------------------------------------------------------------------------------------
Benchmark                                        Time             CPU   Iterations Complex. (N)
--------------------------------------------------------------------------------------------------
PlotterBenchmark/BM_NaivePlot/1024            9.15 us         9.15 us        76317   O(N)
PlotterBenchmark/BM_NaivePlot/8192            74.3 us         74.3 us         9402   O(N)
PlotterBenchmark/BM_NaivePlot/65536            595 us          595 us         1174   O(N)
PlotterBenchmark/BM_NaivePlot/524288          4790 us         4790 us          146   O(N)
PlotterBenchmark/BM_LODPlot/1024              1.51 us         1.51 us       462198   O(1)
PlotterBenchmark/BM_LODPlot/8192              1.62 us         1.62 us       431526   O(1)
PlotterBenchmark/BM_LODPlot/65536             1.65 us         1.65 us       424434   O(1)
PlotterBenchmark/BM_LODPlot/524288            1.66 us         1.66 us       422171   O(1)
Analysis:
BM_NaivePlot: Look at theTimecolumn. As the input size (N, the number after the slash) increases 8x, the time also increases roughly 8x (e.g., from ~9 us to ~74 us). This is clear O(N) behavior.BM_LODPlot: The time barely changes. It stays nearly constant at ~1.6 us whether it's processing 1,024 points or over half a million. This is the O(1) (or O(W)) behavior we designed for!
This numerical result is the definitive proof of your system's efficiency. You've just validated the core premise of the LOD plotter.
To make this result even more compelling for a portfolio, you should visualize it. You can export the benchmark results to a CSV file:
./your_benchmark_executable --benchmark_format=csv > results.csv
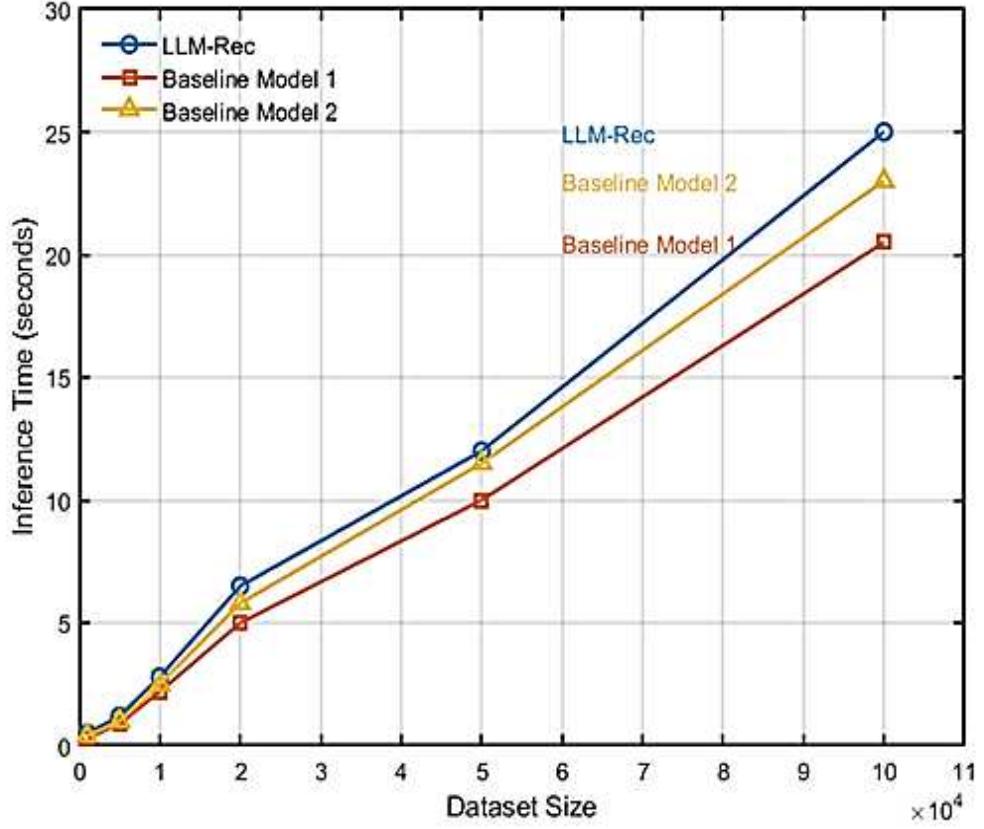
You can then use any plotting software (like Python's Matplotlib, Gnuplot, or even Excel) to create a graph. It will powerfully illustrate the performance difference, much like the example graph below.
This entire process—from hypothesis to benchmark implementation to data visualization—is a cornerstone of professional systems engineering.
A Speed-Up for Charting on Embedded
The performance leap we've just measured is exactly what the theory predicted. Let's revisit the article that inspired our MinMaxTree to see how our results align with their findings.
Re-read the 'Results' section. The author contrasts the 'naïve approach' (over 2 seconds) with the optimized one (3 ms), a speedup of nearly 1000x. The author's reply in the comments also details using a timer around the render loop, which is conceptually similar to what our Google Benchmark fixture achieves in a more structured way. Our benchmark has rigorously confirmed this same principle for our own code.
Conclusion
Congratulations on completing this crucial validation step! You have not only implemented a complex data structure but have now also empirically proven its superior performance.
Key Takeaways:
- You designed a benchmark to compare a naive O(N) algorithm with a sophisticated O(1) algorithm.
- You learned to use Google Benchmark fixtures (
SetUpandTearDown) to manage state and isolate the code being measured. - You executed the benchmark with exponentially increasing data volumes using
RangeMultiplier. - Most importantly, you analyzed the results to confirm that the LOD plotter's rendering time is constant for large datasets, validating its design.
- You learned how to export benchmark data for visualization, a key skill for communicating performance results.
What's Next?
You have now built and verified the core components of the telemetry system: a high-performance capture pipeline and a high-performance visualization primitive. The final step is to put them together.
In the next module, Integrating and Polishing the Final Application, we will begin connecting all the pieces. The first lesson's objective will be: Connect the telemetry capture pipeline's consumer thread to the plotter's data storage. We will take the events from our lock-free SPSC queues and feed them into the plotter's data structures, finally making our system a cohesive, end-to-end application.