Hello! Welcome back to your course on building a high-performance telemetry engine.
In our last lesson, you implemented interactive panning, giving you the ability to navigate your data along with the centered zooming feature we built previously. You now have a solid foundation for an interactive data viewer.
This lesson addresses the next crucial feature for any analysis tool: Display a tooltip with the precise value and timestamp when hovering the mouse over the plot. This moves us from simply navigating the data to actively inspecting it, which is the core purpose of a profiler. This feature is a small but critical step in making your plotter genuinely useful.
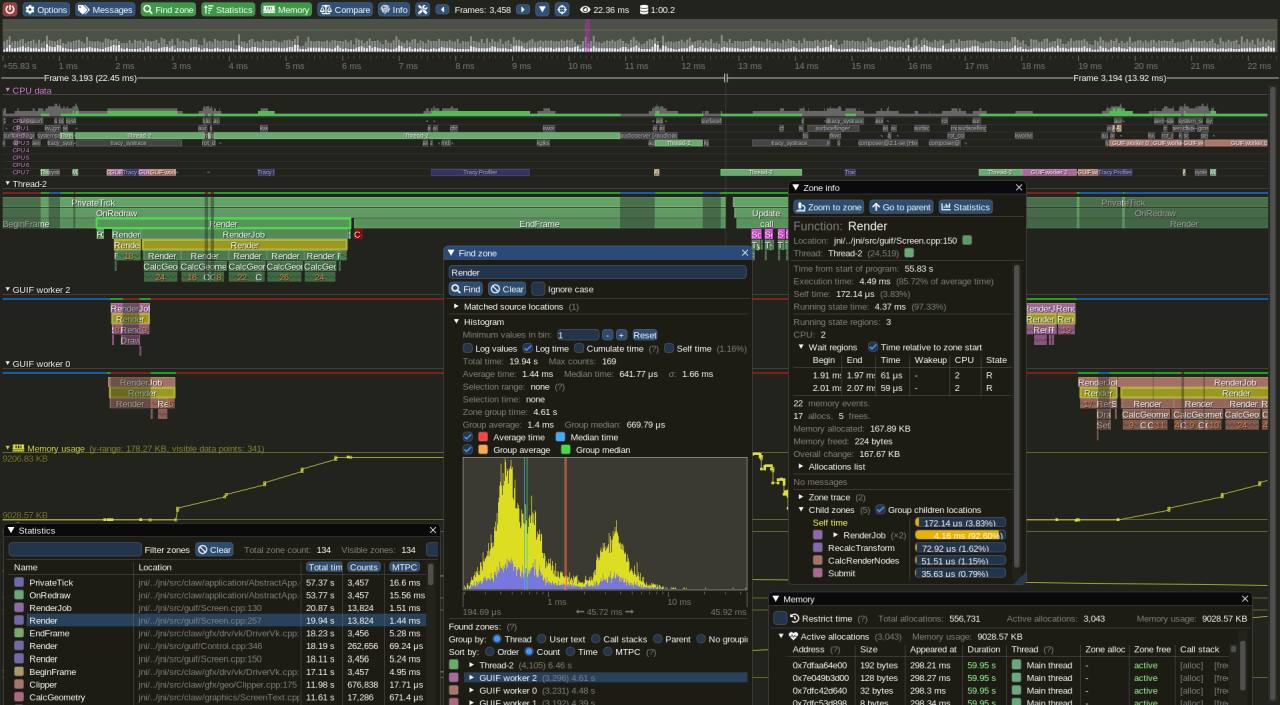
The Anatomy of a Tooltip
Implementing a tooltip in your plotter involves two main steps, both of which build on concepts you've already mastered:
- Finding the Hovered Data Point: When the user's mouse is over the plot, we must convert the mouse's screen coordinates back into world coordinates (specifically, the timestamp on the x-axis). Then, we'll search our dataset to find the data point closest to that timestamp.
- Displaying the Tooltip: Once we have the correct data point, we'll use ImGui's simple but powerful tooltip API to display its timestamp and value in a small window that follows the cursor.
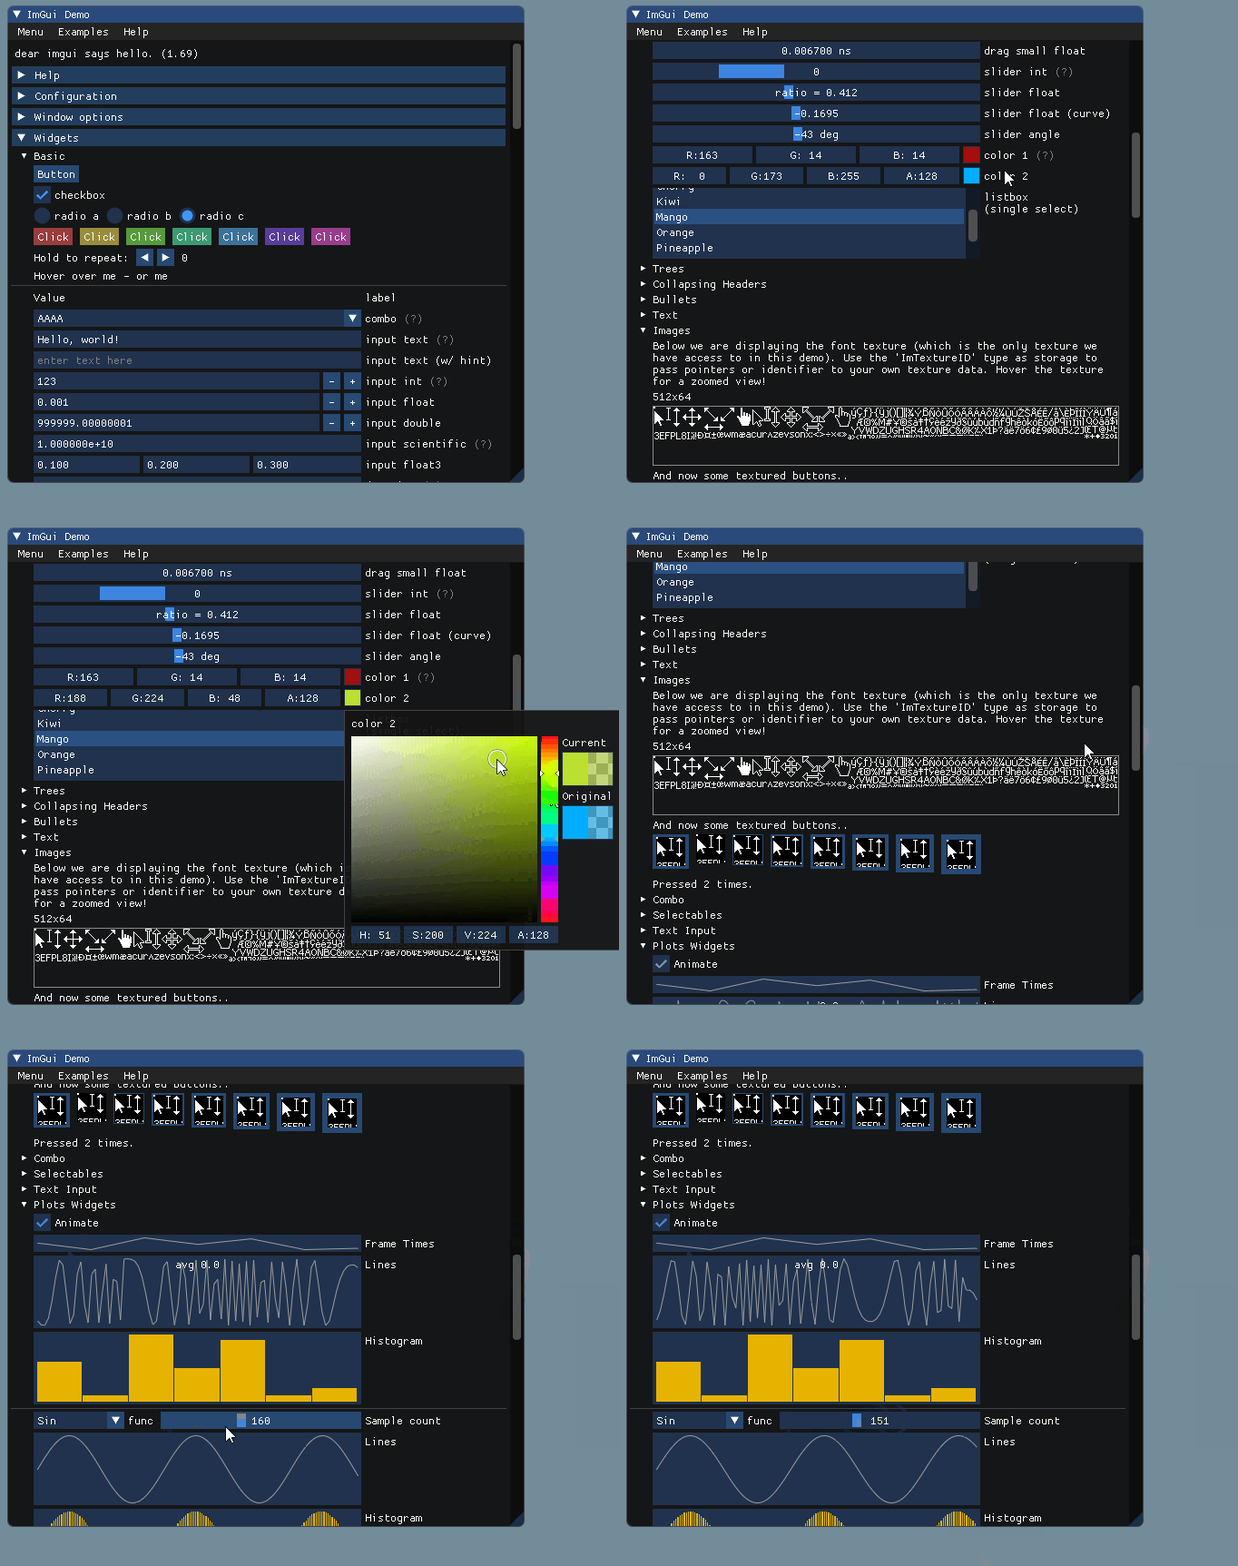
Let's break down how to implement this.
Step 1: From Mouse Position to Data Index
The logic for this lives inside your handleInput function, right alongside your panning and zooming code.
-
Check for Hover: You already use
ImGui::IsItemHovered()after creating yourInvisibleButtonto detect when the mouse is over the plot area. We'll reuse thisif (is_hovered)block. -
Screen to World: Inside the
if (is_hovered)block, the first thing you need is the mouse's position in world coordinates. YourscreenToWorldfunction is perfect for this.ImVec2 mouse_pos_world = screenToWorld(ImGui::GetIO().MousePos); -
Find the Closest Data Point: Now you have a target timestamp (
mouse_pos_world.x). The next task is to find the index of the data point in yourm_dataarray that is closest to this timestamp.Since your data is sorted by timestamp, the most efficient way to do this is with a binary search. The C++ standard library provides
std::lower_boundfor this purpose. Given your computer science background, you'll recognize its efficiency over a linear scan, especially as your datasets grow.std::lower_boundfinds the first element that is not less than the value you're searching for. This gets us very close, but the point before it might be the actual closest one. So, the standard pattern is:- Use
std::lower_boundto find the insertion point. - Compare the distance from your target time to the found element and the element just before it.
- The one with the smaller distance is your closest match.
- Use
Let's update your LODPlotter class to store the result of this search. We'll add a member variable to hold the index of the hovered data point.
// In your LODPlotter.h
class LODPlotter {
    // ... existing members
    int m_hoveredDataIndex; // Will be -1 if nothing is hovered

public:
    LODPlotter() : /* ... existing initializers ... */, m_hoveredDataIndex(-1) {}
    // ...
};
Now, let's update handleInput to perform the search and update m_hoveredDataIndex.
// In LODPlotter::handleInput
void LODPlotter::handleInput(const ImVec2& canvas_pos, const ImVec2& canvas_size) {
    ImGuiIO& io = ImGui::GetIO();
    ImGui::SetCursorScreenPos(canvas_pos); // Important: position the invisible button correctly
    ImGui::InvisibleButton("##canvas", canvas_size);
    const bool is_hovered = ImGui::IsItemHovered();
    const bool is_active = ImGui::IsItemActive();

    // Always reset the hover index at the start of the frame.
    m_hoveredDataIndex = -1;

    if (is_hovered && !m_data.empty()) {
        // Get mouse position in world coordinates
        const ImVec2 mouse_pos_world = screenToWorld(io.MousePos);

        // Find the closest data point using binary search
        auto it = std::lower_bound(m_data.begin(), m_data.end(), mouse_pos_world.x,
            [](const DataPoint& dp, double time) {
                return dp.timestamp < time;
            });

        // Determine the closest index
        if (it == m_data.end()) {
            // Mouse is past the last data point, so snap to it
            m_hoveredDataIndex = m_data.size() - 1;
        } else if (it == m_data.begin()) {
            // Mouse is before the first data point, snap to it
            m_hoveredDataIndex = 0;
        } else {
            // Compare the found point and the one before it
            auto prev_it = it - 1;
            double dist1 = std::abs(it->timestamp - mouse_pos_world.x);
            double dist2 = std::abs(prev_it->timestamp - mouse_pos_world.x);
            m_hoveredDataIndex = (dist1 < dist2) ? std::distance(m_data.begin(), it) : std::distance(m_data.begin(), prev_it);
        }

        // --- Zooming logic (as before) ---
        // ...
    }

    // --- Panning logic (as before) ---
    // ...
}
Note: This code assumes m_data is a std::vector<DataPoint> where DataPoint has a double timestamp member.
Step 2: Displaying the Tooltip and a Visual Marker
Now that handleInput identifies the hovered point, your draw function can use that information to render the feedback. This keeps our logic clean: handleInput updates state, and draw renders state.
The ImGui API for tooltips is very simple: ImGui::BeginTooltip() starts a tooltip context, and ImGui::EndTooltip() finishes it. Any widget calls made in between will appear inside the tooltip window.
You can find excellent, practical examples of this in the ImGui community. The following reading shows how other developers have implemented this exact feature.
How to draw multiple datasets in the same PlotLines? + Grid
This GitHub issue thread, 'How to draw multiple datasets in the same PlotLines? + Grid', contains several iterations of a custom plot function. The code snippets are a goldmine for learning how to implement features like tooltips.
Skim through the code provided in the comments by users 'JaapSuter' (section 1) and 'maxint' (section 2). Focus on the part that starts with if (IsHovered(...) or if (IsItemHovered()). Notice the pattern: calculate an index from the mouse position, then call ImGui::BeginTooltip(), display text, and finally call ImGui::EndTooltip().
Inspired by those examples, let's add the rendering logic to your draw function. We will not only show the tooltip but also draw a vertical line and a circle on the plot to give the user clear visual feedback.
// In LODPlotter::draw()
void LODPlotter::draw() {
    // ... canvas setup, handleInput call, background rendering ...

    draw_list->PushClipRect(canvas_p0, canvas_p1, true);

    // ... draw axes, grid, and main plot data (from your min-max tree) ...

    // --- Draw Hover Feedback ---
    if (m_hoveredDataIndex != -1) {
        // Get the hovered data point
        const auto& dataPoint = m_data[m_hoveredDataIndex];

        // Convert its world position to screen coordinates for drawing
        ImVec2 marker_pos_screen = worldToScreen({(float)dataPoint.timestamp, dataPoint.value});

        // Ensure the marker is within the canvas to avoid drawing glitches
        if (marker_pos_screen.x >= canvas_p0.x && marker_pos_screen.x <= canvas_p1.x) {
            // 1. Draw a visual marker
            // Vertical line spanning the height of the plot
            draw_list->AddLine({marker_pos_screen.x, canvas_p0.y}, {marker_pos_screen.x, canvas_p1.y}, IM_COL32(255, 255, 0, 100));
            // Circle on the data point itself
            draw_list->AddCircleFilled(marker_pos_screen, 4.0f, IM_COL32(255, 255, 0, 255));

            // 2. Display the tooltip
            ImGui::BeginTooltip();
            ImGui::Text("Time:  %.4f s", dataPoint.timestamp);
            ImGui::Text("Value: %.4f", dataPoint.value);
            ImGui::EndTooltip();
        }
    }

    draw_list->PopClipRect();

    // ... any final rendering for the widget ...
}
With this, your handleInput function now correctly finds the point under the mouse, and your draw function provides clear, multi-faceted feedback to the user.
Test your understanding!
Question: How would you modify the tooltip to show the change in value from the previous data point (a "delta")?
Show answer
You would first check if m_hoveredDataIndex is greater than 0. If it is, you have a previous point to compare against.
Inside the if (m_hoveredDataIndex != -1) block:
ImGui::BeginTooltip();
ImGui::Text("Time:  %.4f s", dataPoint.timestamp);
ImGui::Text("Value: %.4f", dataPoint.value);

// Check if a previous point exists
if (m_hoveredDataIndex > 0) {
    const auto& prevDataPoint = m_data[m_hoveredDataIndex - 1];
    float delta = dataPoint.value - prevDataPoint.value;
    ImGui::Separator();
    ImGui::Text("Delta: %s%.4f", (delta >= 0 ? "+" : ""), delta);
}

ImGui::EndTooltip();
This requires accessing m_data[m_hoveredDataIndex - 1], which is why the check for m_hoveredDataIndex > 0 is essential to prevent out-of-bounds access.
Conclusion
Congratulations! You have added a crucial layer of interactivity to your plotter. It can now not only be navigated but also queried for specific data values, making it a functional analysis tool.
Key Takeaways:
- A robust tooltip implementation combines input handling (detecting hover and finding the relevant data) and rendering (displaying the tooltip and visual markers).
- Your
screenToWorldfunction is the key to translating user input into the data's coordinate space. - Using
std::lower_boundis an efficient, standard C++ way to perform a binary search on sorted data. - The
ImGui::BeginTooltip()/ImGui::EndTooltip()API provides an easy way to show context-sensitive information. - Providing additional visual cues, like a marker line or circle, significantly improves the user experience.
What's Next?
You have now built a powerful, interactive, and optimized data plotter. The final step is to connect it to the data source we'll be building. In the next module, you will finally integrate everything together. The first lesson will be: Connect the telemetry capture pipeline's consumer thread to the plotter's data storage. This is where your high-performance back-end will meet your interactive front-end.