Welcome to our next lesson. In our previous session, we delved into Spring Boot's externalized configuration and profiles, establishing how a single application artifact can be adapted to run across multiple environments. Now that we know how to configure our application, the next logical step is to understand how we can monitor and manage it once it's running in those environments.
This is where Spring Boot Actuator comes in. It's a critical component for building production-grade services, providing a set of tools to expose operational information about your running application. In any technical interview discussing microservices or system reliability, being able to articulate how you monitor your services is essential.
In this lesson, you will learn to explain the role of Spring Boot Actuator endpoints, with a particular focus on their use in health checks and production monitoring. We will cover how these endpoints integrate with platforms like Kubernetes and the best practices for securing them.
1. What is Spring Boot Actuator?
Spring Boot Actuator is a sub-project of Spring Boot that adds production-ready features to your application. When you include the Actuator starter, your application automatically gets a series of built-in "endpoints" that can be exposed over HTTP or JMX. These endpoints provide a wealth of information, from application health to detailed metrics and environment properties.
To get started, you simply add the spring-boot-starter-actuator dependency to your project.
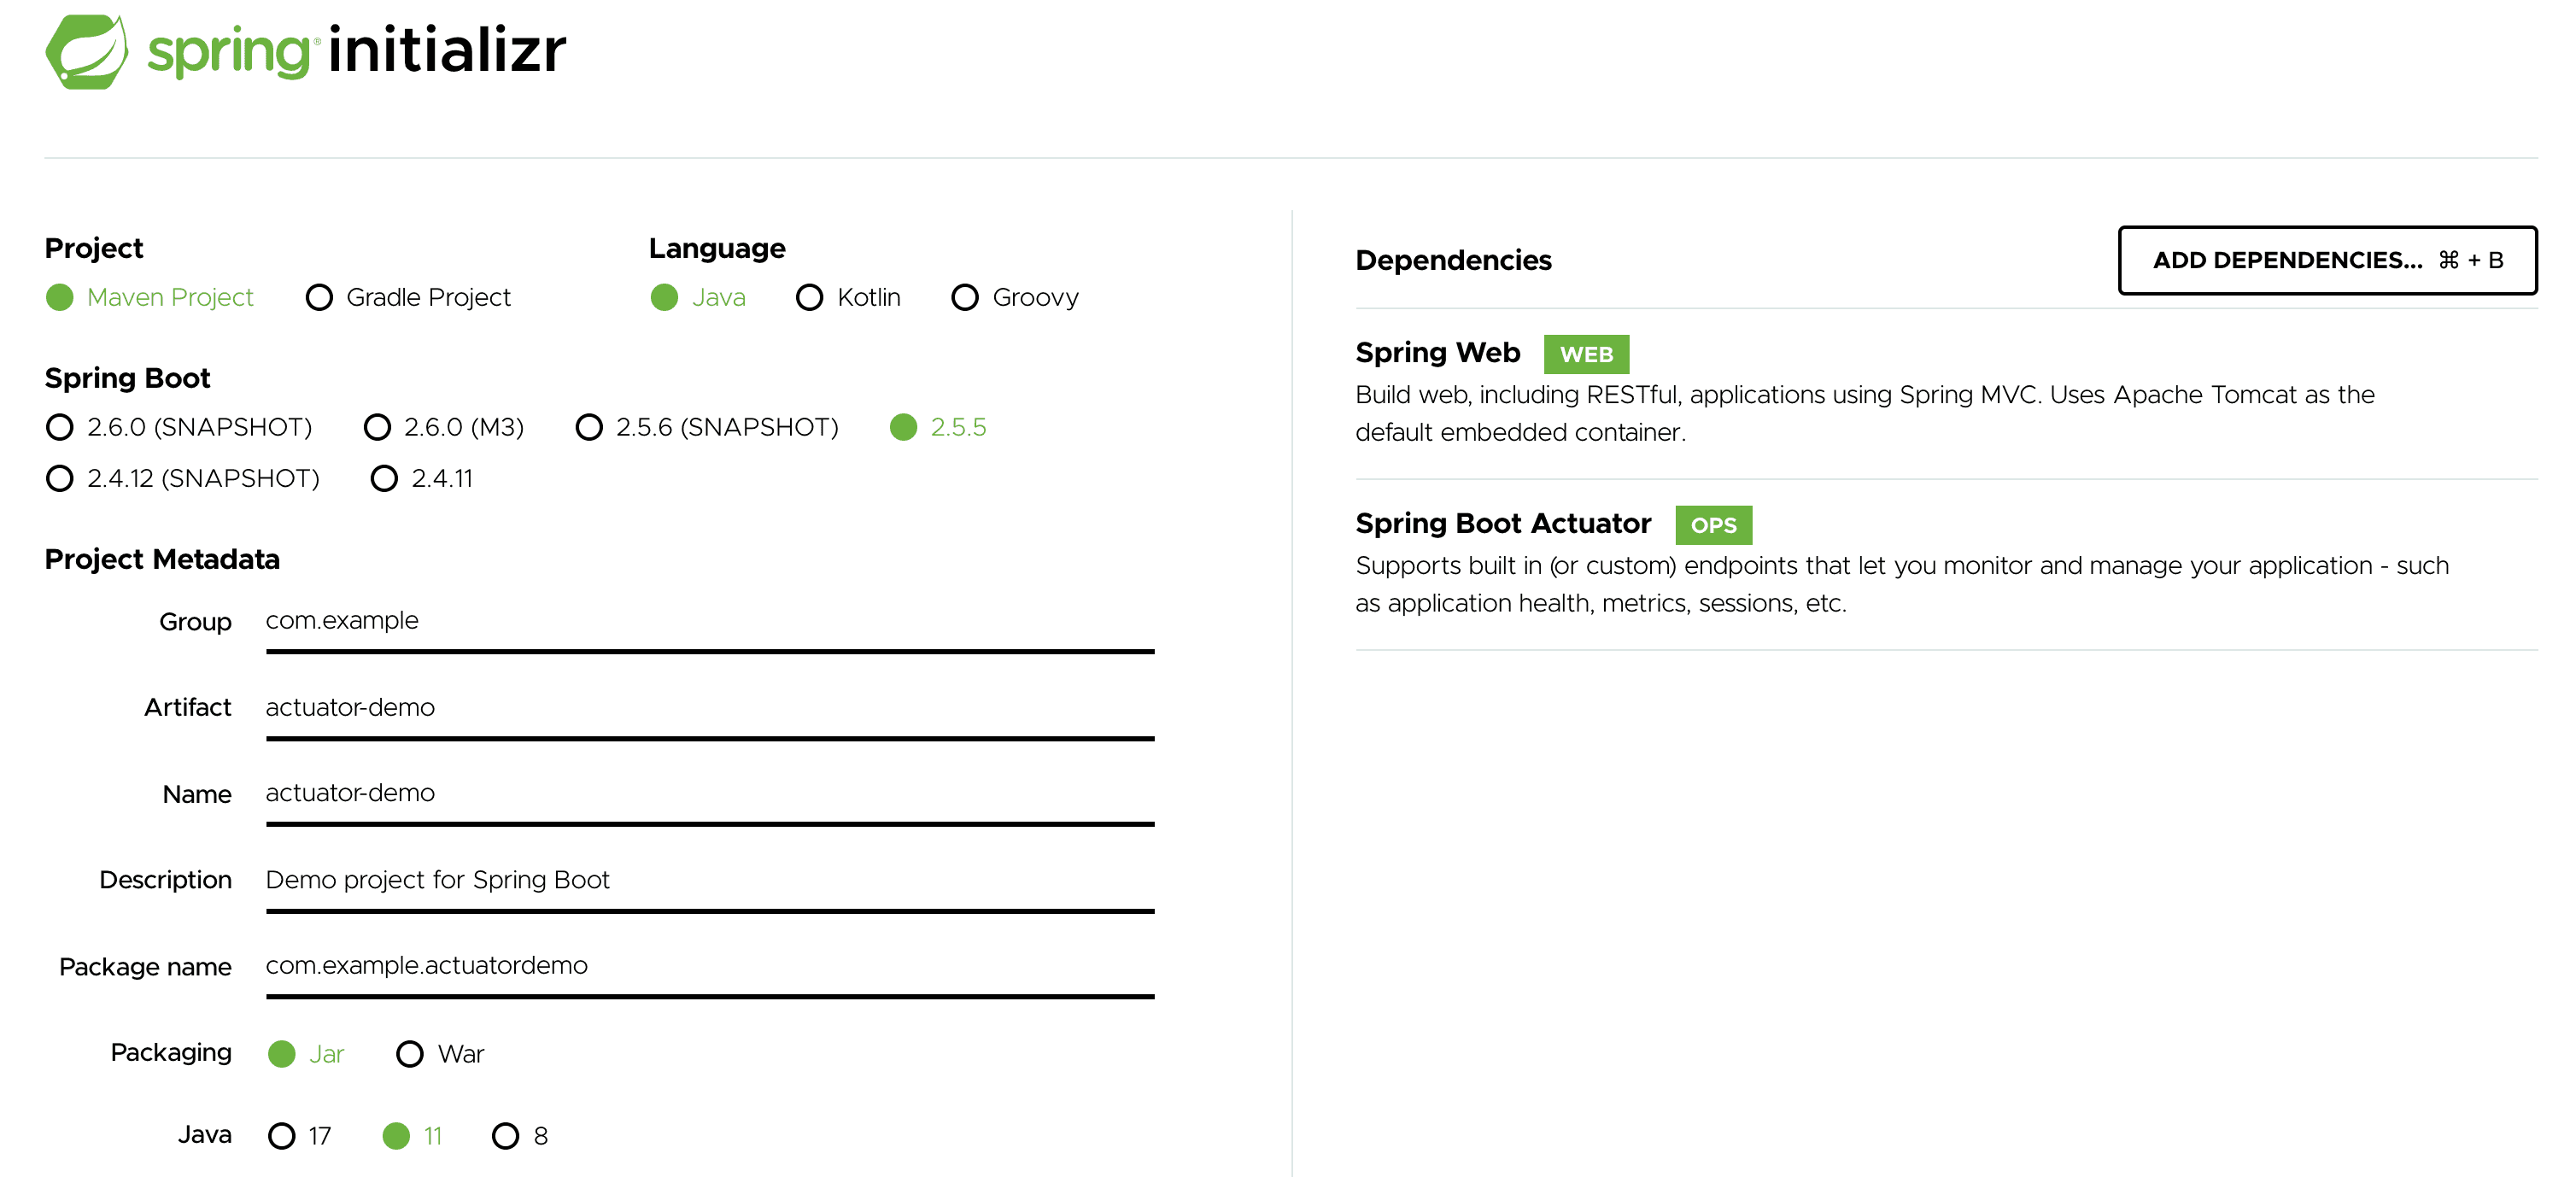
Once the dependency is added and the application is running, Actuator exposes a discovery page at the /actuator path.
Getting your application production-ready with Actuator by Michael Vitz @ Spring I/O 2025
This presentation from Spring I/O provides an excellent introduction to the purpose and core concepts of Actuator.
Watch the initial segments to understand the "why" behind Actuator and how it is enabled. First, watch the introduction from this point to understand Actuator's goal of making applications "production-ready". Next, see how the starter is added and how endpoints are exposed over the web from this section. The speaker highlights a crucial point: for security reasons, modern Spring Boot versions only expose the /health endpoint by default.
As mentioned in the video, security is paramount. By default, only a minimal set of endpoints are exposed over HTTP to prevent accidental leakage of sensitive information.
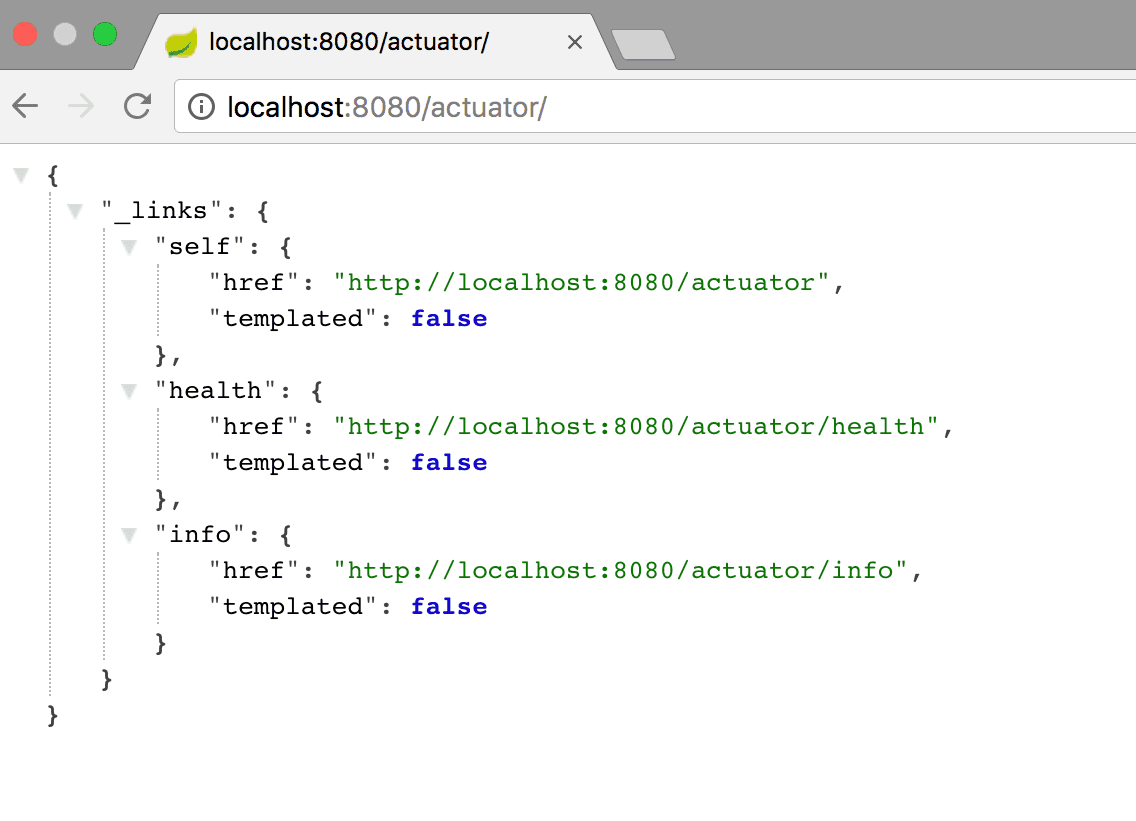
To expose more endpoints for monitoring, you need to explicitly configure it in your application.yml or application.properties file.
management:
  endpoints:
    web:
      exposure:


        # Use '*' to expose all, or a comma-separated list
        # For production, be explicit: health,info,prometheus,metrics
        include: "*"
The article below provides a good overview of the most common endpoints and how to enable them.
Spring Boot Actuator: Health check, Auditing, Metrics gathering and ...
This guide from CalliCoder offers a clear, structured introduction to Actuator.
Read the section on Actuator endpoints to reinforce the default behavior. Skim the table of endpoints to get a sense of the breadth of information Actuator can provide. We'll discuss the most important ones shortly. Finally, read the section on exposing endpoints, which shows the management.endpoints.web.exposure.include property.
2. The Health Endpoint: The Heartbeat of Your Service
The /actuator/health endpoint is arguably the most critical part of Actuator. It provides a simple status (UP or DOWN) that automated systems can use to determine if the application is functioning correctly. This is the primary mechanism used by load balancers and container orchestrators to perform health checks.
Spring Boot automatically provides several HealthIndicators that contribute to the overall health status. For instance:
- If
spring-boot-starter-data-jpais on the classpath, aDataSourceHealthIndicatorchecks the connection to your database. - If you use Redis, a
RedisHealthIndicatorchecks connectivity to the Redis server. - A
DiskSpaceHealthIndicatorchecks for adequate free disk space.
If any of these essential checks fail, the main health endpoint will report DOWN.
By default, the /health endpoint just returns the status. For debugging, you can configure it to show details from all contributing health indicators.
How to Configure Spring Boot Actuator for Health Checks - OneUptime
This OneUptime article is an excellent, in-depth guide to configuring health checks for production systems.
Read the basic configuration section to see how to enable detailed health information using show-details. Next, review the response structure section to see an example of a detailed health response, which includes individual components like db and diskSpace.
Custom Health Indicators
For a comprehensive health check, you often need to verify the status of dependencies that are specific to your application, such as a downstream microservice or a third-party payment gateway. You can achieve this by creating your own HealthIndicator.
A custom HealthIndicator is a Spring bean that implements the HealthIndicator interface and its health() method. This is a common requirement in microservice development and a great topic to discuss in an LLD interview.
How to Configure Spring Boot Actuator for Health Checks - OneUptime
This section of the OneUptime article provides excellent code examples for creating custom health indicators.
First, study the PaymentApiHealthIndicator example under the heading Creating a Custom Health Indicator. It demonstrates checking an external API and returning UP or DOWN based on the result. Then, review the CacheHealthIndicator example. Pay close attention to how it returns a custom DEGRADED status. This is a powerful pattern for situations where a non-critical dependency (like a cache) is unavailable, but the application can still function, albeit with reduced performance.
3. Health Checks in a Containerized World: Liveness vs. Readiness
Your experience with Kubernetes is highly relevant here. Kubernetes uses two primary types of probes to manage container lifecycles, and Actuator integrates with them perfectly.
- Liveness Probe: Answers the question, "Is the application running correctly?" If this probe fails, Kubernetes assumes the application is in an unrecoverable state (e.g., deadlocked) and restarts the container.
- Readiness Probe: Answers the question, "Is the application ready to accept new traffic?" If this probe fails, Kubernetes keeps the container running but removes it from the service's load-balancing pool.
A common mistake is to put a database health check in a liveness probe. If the database goes down, all application instances will fail their liveness checks and be restarted by Kubernetes, leading to a "crash loop" that doesn't solve the underlying database issue. The correct approach is to put the database check in the readiness probe. This way, if the database is down, the instances are marked as "not ready," traffic is halted, and they are given a chance to recover once the database is back online.
Spring Boot Actuator supports this distinction through Health Groups. You can configure separate groups for liveness and readiness, including only the relevant health indicators in each.
How to Configure Spring Boot Actuator for Health Checks - OneUptime
This part of the OneUptime article explains exactly how to map Actuator health checks to Kubernetes probes.
Read the section on configuring groups. Note how the liveness group is kept minimal, while the readiness group includes dependencies like db and redis. Next, look at the deployment.yaml in the Kubernetes Integration section. This shows how the /actuator/health/liveness and /actuator/health/readiness paths are mapped directly to the livenessProbe and readinessProbe definitions in a Kubernetes deployment.
4. Other Essential Endpoints for Monitoring
While the health endpoint is for automated checks, other endpoints are invaluable for human operators and monitoring systems.
| Endpoint | Description | Interview Talking Point |
|---|---|---|
/metrics |
Provides detailed metrics (e.g., JVM memory usage, CPU load, HTTP request latencies). Integrates with Micrometer to export data to monitoring systems like Prometheus. | "We use the /metrics endpoint with Prometheus to collect time-series data and Grafana to build dashboards for monitoring application performance and setting up alerts." |
/env |
Displays all environment properties loaded by Spring. Sensitive values (like passwords) are automatically redacted. | "The /env endpoint is my go-to for debugging configuration issues in a live environment. It shows the final, resolved property values from all sources." |
/loggers |
Allows you to view and dynamically change the log levels of your application at runtime without a restart. | "When troubleshooting a production issue, we use the /loggers endpoint to temporarily set a specific package's log level to DEBUG to get more context, then revert it once the issue is resolved." |
/beans |
Lists all the beans in the Spring ApplicationContext. | "The /beans endpoint is a powerful debugging tool to confirm that my expected beans are being created and wired correctly by the auto-configuration." |
/info |
Displays general application information, which you can customize with build details (from Maven/Gradle) and git properties. | "We populate the /info endpoint with the Git commit hash and build version, so we know exactly which version of the code is running in any environment." |
5. Securing Actuator Endpoints
Actuator endpoints can expose sensitive operational data. Securing them is not optional.
- Run on a Separate Port: The most effective security measure is to run the Actuator endpoints on a different port than your main application traffic. This management port can then be firewalled off from public access, allowing only internal systems (like your monitoring tools or Kubernetes's kubelet) to access it.
management: server: port: 8081 # Separate from server.port=8080 - Use Spring Security: In addition to a separate port, you should always use Spring Security to protect the endpoints. A common pattern is to permit anonymous access to the main
/healthendpoint (and the liveness/readiness groups) while requiring an authenticated user with a specific role (e.g.,ACTUATOR_ADMIN) for all other endpoints.
How to Configure Spring Boot Actuator for Health Checks - OneUptime
This final section of the OneUptime guide covers the essential security configurations.
First, review the SecurityConfig.java example under the Securing Health Endpoints heading. It shows a typical Spring Security configuration that allows public access to health probes while securing everything else. Next, examine the YAML snippet for running Actuator on a separate port. This is a critical best practice for production security.
Conclusion
In this lesson, we've seen how Spring Boot Actuator provides the essential tools for making an application production-ready. You are now prepared to discuss how to monitor a Spring Boot microservice, a key competency for any senior engineering role.
Here are the key takeaways for your interviews:
- Actuator's Role: It provides production-ready features for monitoring and managing applications through a series of endpoints.
- Health Checks: The
/healthendpoint is the cornerstone of automated health monitoring, used by load balancers and container orchestrators. - Liveness vs. Readiness: Use Actuator's Health Groups to create distinct
livenessandreadinessprobes, a critical pattern for reliable operation in Kubernetes. - Custom Indicators: Implement custom
HealthIndicatorbeans to integrate application-specific dependencies into the health status. - Key Monitoring Endpoints: Beyond health, endpoints like
/metrics,/env, and/loggersare vital for performance monitoring, configuration debugging, and live troubleshooting. - Security is Paramount: Always secure Actuator endpoints, preferably by running them on a separate, non-public management port and using Spring Security for fine-grained access control.
In our next lesson, we will shift our focus to application security. We'll take a deep dive into the OAuth2 Authorization Code grant flow, understanding how modern applications delegate authentication and authorization to trusted providers.