In our previous lesson, we set up your Metabase environment and took a tour of its interface, identifying the key areas for browsing data and creating new analyses. You now have the lay of the land. It's time to put that knowledge to work and build your first real analysis.
Today's objective is to answer a business question using Metabase's visual query builder. This is a fundamental skill for any analyst and is often the first step in exploring a dataset. We will focus on two core actions: filtering data to narrow our focus and summarizing it to find meaningful aggregates. For you, this will also be an exercise in seeing how a graphical interface translates to the SQL concepts you're already familiar with.
The Anatomy of a Question
In Metabase, any query, chart, or data exploration you create is called a "Question." This terminology reinforces the goal of data analysis: to ask questions of your data. The primary tool for non-SQL users is the visual query builder, which allows you to construct a query piece by piece.
Let's start by watching a very brief demonstration of the query builder in action. This will give you a quick visual orientation before we walk through the steps together.
See what Metabase can do in 2 mins
This short video from Metabase provides a high-speed overview of creating a question. Don't worry about catching all the details; just focus on the flow from picking data to filtering and summarizing.
Pay attention to the sequence shown from the query builder part. You'll see the presenter join data, create a metric, and group by a category to produce a chart. We'll be doing a simpler version of this.
Building Your First Question: "How many orders have we received per month?"
This is a classic descriptive analytics question. Let's use the visual query builder to answer it step-by-step.
1. Start a New Question and Pick Your Data
First, navigate to your Metabase homepage.
- Click the + New button in the top right.
- Select Question.
- Metabase will ask you to pick your starting data. Choose the Sample Database, and from its list of tables, select the
Orderstable.
You should now see the query builder interface, with "Orders" selected as your data source. This is the starting point for every question.
2. Filtering the Data
Raw data is often more than you need. The first step in most analyses is to filter the data to the specific subset you're interested in. In SQL, this is your WHERE clause.
Let's refine our question to "How many orders have we received per month in the last three years?"
- In the query builder, click the Filter button.
- A dropdown will appear, listing all the columns in the
Orderstable. Select theCreated Atcolumn. - Metabase is smart about date columns and will offer you a range of time-based filtering options. Select Previous and then enter
3and chooseYearsfrom the dropdown. - Click Add filter.
You have now instructed Metabase to only consider records where the Created At date falls within the last three years.
3. Summarizing the Data
Now for the core of the analysis. We don't want to see every single order; we want to see an aggregated count grouped by month. In SQL, this would be a COUNT(*) with a GROUP BY clause. In Metabase, this is called a "summary."
A summary consists of two parts:
- The Metric: The number you want to calculate (e.g., a count of rows, a sum of a column, an average).
- The Grouping / Breakout: The dimension by which you want to slice your metric (e.g., by month, by product category, by user state).
Let's add our summary:
- Click the Summarize button.
- For the metric, the default
Count of rowsis exactly what we need. - Next to the metric, you'll see the option to add a grouping. Click
Pick a column to group by. - Select
Created At. Metabase will automatically group it by month, but you can click on "by month" to choose a different granularity (like day, week, or year). "Month" is perfect for our question.
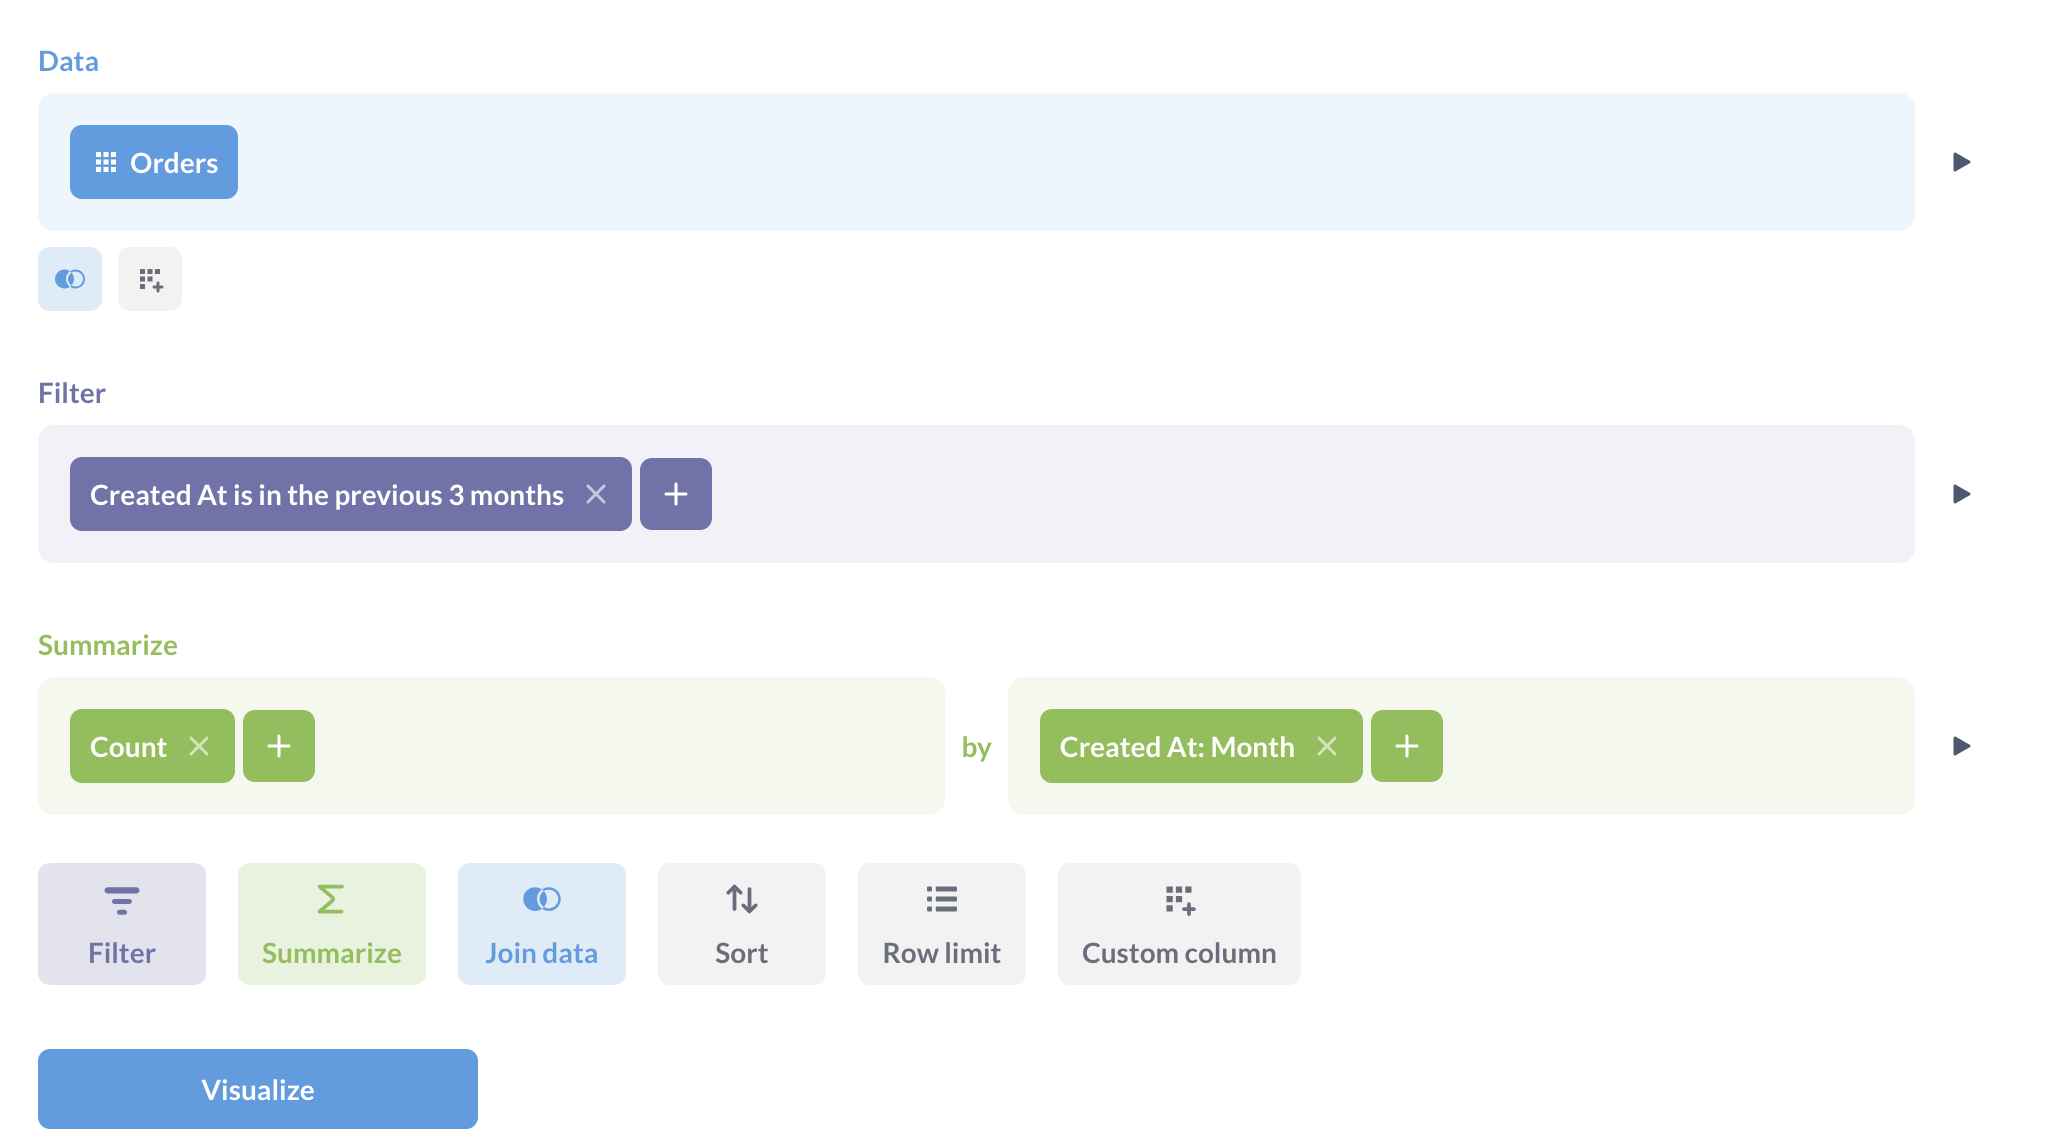
The summary section should now read Count by Created At: Month.
4. Visualizing the Result
Now, click the blue Visualize button at the bottom left. Metabase will run the query you've constructed and, because you've grouped by a time series, it will automatically generate a line chart showing the count of orders for each month over the last three years.
Congratulations, you've just answered your first business question with Metabase!
Bridging the Gap: From Clicks to Code
As a developer, you understand that this user-friendly interface must be generating code behind the scenes. Metabase makes it easy to see the SQL that your visual query produces. This is an incredibly powerful feature for learning and for understanding what your team's tools are doing under the hood.
In the top-right corner of the query builder, you should see an icon that looks like a terminal or code editor, labeled "View the SQL". Click it.

You'll see a SQL query that contains SELECT, COUNT(*), FROM, GROUP BY, and ORDER BY clauses. Notice how the visual steps you took—picking a table, adding a filter, and defining a summary—map directly to these standard SQL statements. The DATE_TRUNC function is what Metabase uses to group the Created_At timestamp into monthly buckets.
This "View the SQL" feature is your bridge between the world of business intelligence tools and your own technical background.
For developers accustomed to writing SQL, the way Metabase separates "adding a column" from "summarizing" can be a new concept. The following reading clarifies this distinction.
Summarize data | Metabase Learn
This short section from a Metabase Learn guide is written specifically for people with a SQL background. It explains a key conceptual difference in how Metabase handles aggregations compared to a typical SQL SELECT statement.
Read the final section of the article under the heading Note for SQL experts. This will help solidify your mental model of how the visual builder works.
Your Turn to Practice
Now it's your turn to build a question from scratch. Try to answer the following:
"What is the average order Subtotal, grouped by Product → Category?"
To do this, you will need to:
- Start a new question.
- This time, you will need to join data. When you pick your starting data (
Orderstable), look for the "Join data" button. Use it to join theProductstable. Metabase will automatically suggest joining onProduct ID. - In the Summarize section, change the metric from
Count of rowstoAverage of...and select theSubtotalcolumn from theOrderstable. - For the grouping, select the
Categorycolumn from the joinedProductstable. - Visualize the result. Metabase will likely choose a bar chart.
Take your time to work through it. Don't forget to use the "View the SQL" button to see how a JOIN and an AVG function are represented.
Conclusion
In this lesson, you made the leap from theory to practice by building your first analysis in Metabase. You learned how to translate a business question into a series of steps in the visual query builder, using filters and summaries to arrive at a meaningful answer.
Key Takeaways:
- A Metabase "Question" is built by chaining together steps: picking data, filtering, and summarizing.
- Filtering narrows down your data, analogous to a SQL
WHEREclause. - Summarizing aggregates your data, analogous to functions like
COUNT,SUM,AVGcombined with aGROUP BYclause. - The "View the SQL" feature is a powerful tool that reveals the underlying code generated by the visual builder, connecting the UI to familiar SQL concepts.
You've now experienced the workflow of a non-technical analyst. In our next lesson, we will switch gears and use the native SQL editor. This will allow you to leverage your existing coding skills directly, while we begin to explore the specific types of SQL queries and patterns that are common in analytics but might be new to you.