Hello! Welcome to your second lesson.
In our first session, you successfully created your n8n Cloud account and got a quick look at the n8n workspace. This sets the stage for everything we'll do in this course.
Today, we'll take a structured tour of the n8n interface. The goal is to get you comfortable navigating the main areas you'll be using constantly. We'll explore the canvas, where you build your workflows; the node panel, which is your toolkit of automation blocks; and the execution log, which shows you what your workflows have done. Mastering this will give you the confidence to start building your own automations in our next lesson.
Let's get oriented.
Your Workspace: A Guided Tour
When you create a new workflow in n8n, you're brought to the Editor UI. This is your main command center for building, testing, and managing your automations. It consists of three primary areas that we will explore.
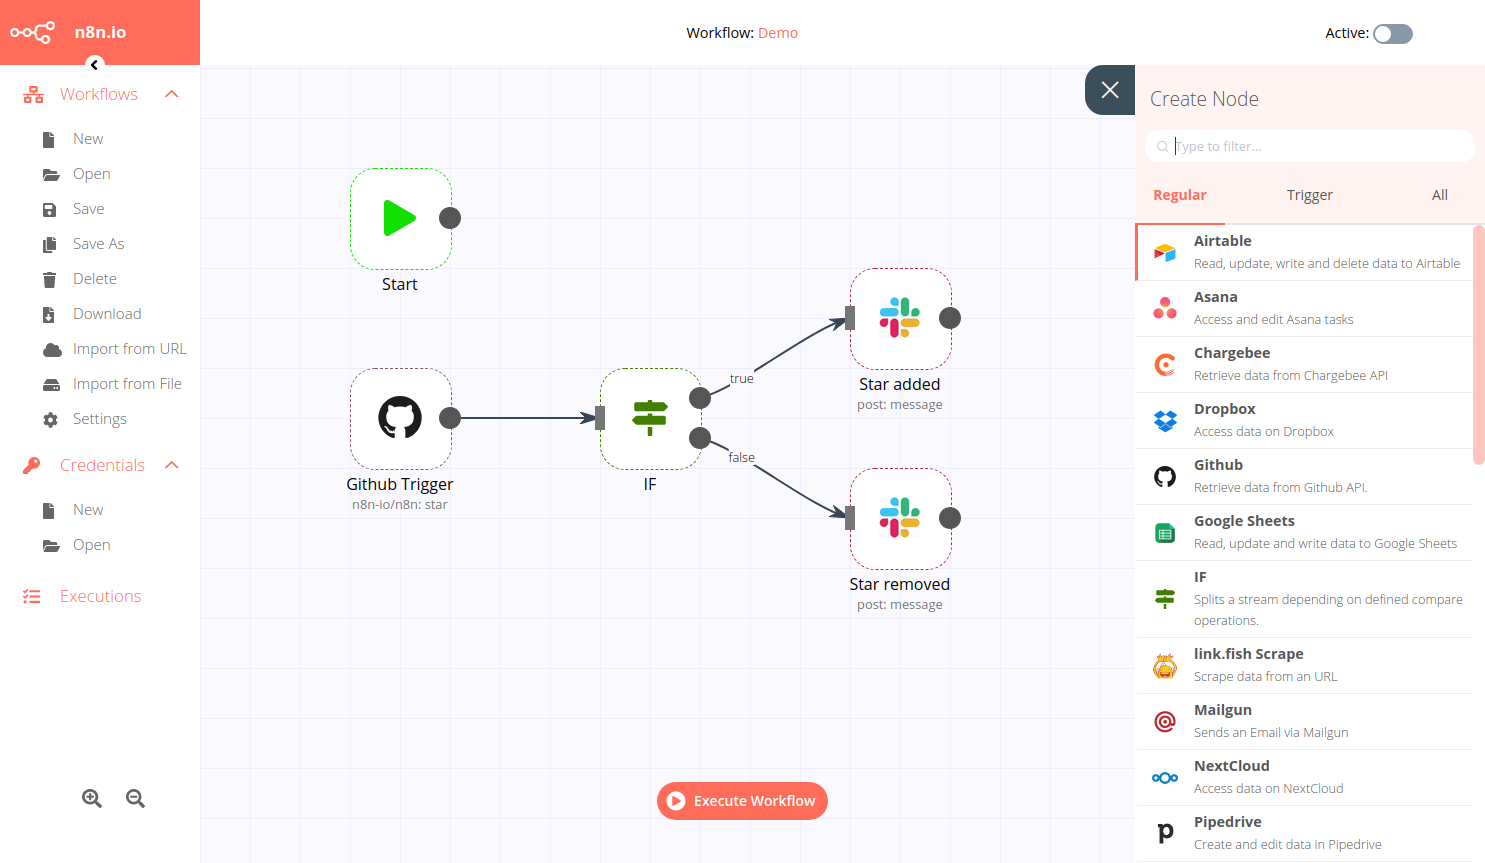
To get a foundational understanding of these areas, we'll use the official n8n documentation. It provides clear, labeled screenshots that are perfect for a first look.
Let's start by reading a brief overview from the n8n documentation, 'Navigating the editor UI'. This will introduce you to the main sections of the interface.
Please read the sections titled 'Editor UI settings', 'Left-side panel', 'Top bar', and 'Canvas'. Focus on getting a general sense of where things are located. Don't worry about memorizing every button yet.
1. The Canvas: Your Building Area
As you just read, the canvas is the large, dotted grid that takes up most of the screen. This is where the magic happens. You'll build your workflows here by placing and connecting different steps, called nodes.
- Building: You add nodes to the canvas and connect them with "noodles" (the lines that connect nodes) to define the flow of your automation.
- Visualizing: The canvas gives you a clear, visual map of your process from start to finish. This makes it much easier to understand what your automation is doing compared to looking at code.
2. The Node Panel: Your Toolkit
If the canvas is your workbench, then the node panel is your toolbox. It contains all the "building blocks" (nodes) you can use in your workflows.
Nodes are categorized by their function:
- Trigger nodes: These start a workflow. Examples include running on a schedule, when a form is submitted, or when a new email arrives.
- Action nodes: These perform a task in an external application, like sending a Gmail message, adding a row to a Google Sheet, or asking ChatGPT a question.
- Core nodes: These help you manipulate data and control the logic within your workflow, like using an IF node to make a decision.
Let's refer back to the n8n documentation to see how to find and add nodes.
This reading from the 'Navigating the editor UI' guide will show you exactly where to find nodes and how to add them to your canvas.
Read the sections titled 'Nodes', 'Finding nodes', and 'Adding nodes'. Pay close attention to the different ways you can open the nodes panel and add a node to the canvas.
The key takeaway is that to add a new step to your workflow, you simply click the + button on the canvas or an existing node, search for the tool or function you need in the node panel, and add it.
Test your understanding!
Imagine you want to create a workflow that automatically saves your new Gmail attachments to Dropbox. Where in the n8n interface would you look to find the "Dropbox" and "Gmail" functionalities?
Show answer
You would open the node panel by clicking the + icon and then use the search bar to find the Gmail node (likely a trigger) and the Dropbox node (an action).
3. The Execution Log: Checking Your Work
Building a workflow is one thing; knowing if it actually worked is another. This is where the execution log comes in.
An execution is a single run of your workflow. The execution log keeps a history of every time your workflow has run, showing you whether it was successful or if it failed. This is the most important place to go when you need to check on your automations or troubleshoot a problem.
You can access the log via the main navigation panel on the left side of the screen, under Executions.
To see this in a more practical context, let's watch a short clip from the video we previewed in the last lesson. The presenter shows how to check the execution log after a workflow has run.
n8n Quick Start Tutorial: Build Your First Workflow [2025]
In this segment from the 'n8n Quick Start Tutorial', you'll see a live demonstration of how test runs and real (production) runs appear in the execution log.
Watch the clip from 00:12:10 to 00:13:52. Pay attention to how the presenter navigates to the 'Executions' tab and points out the difference between a 'test' execution (with the beaker icon) and a 'production' execution.
As the video shows, the execution log allows you to:
- Confirm that your workflow ran when it was supposed to.
- See if it completed successfully or encountered an error.
- Click into a specific execution to see the exact data that passed through each step, which is invaluable for fixing problems.
Test your understanding!
You set up an automation to send you a Slack message every morning at 9 AM. One morning, you don't receive the message. What is the very first place you should check in n8n to investigate the issue?
Show answer
You should go to the Execution Log. There, you can see if the workflow tried to run at 9 AM and, if it did, whether it resulted in an error. If there's an error, you can inspect that execution to find the cause.
Conclusion
Great work today! You've just completed a full tour of the n8n environment. While it might seem like a lot of information, getting familiar with these three areas is the key to becoming proficient with the tool.
Key Takeaways:
- The Canvas is your visual workspace for arranging and connecting nodes to build automations.
- The Node Panel is your toolkit, containing all the available triggers and actions you can add to your canvas.
- The Execution Log is your monitoring and debugging center, providing a history of every workflow run and its outcome.
Next Lesson Preview:
You now know your way around the workshop. In the next lesson, it's time to pick up the tools and build something. We will create your first simple workflow from scratch using a manual trigger and see it run successfully.