Hello! Welcome back to our course on professional iOS development.
In our last lesson, we dove into the Allocations instrument to analyze your app's memory consumption, tackling both temporary spikes and persistent growth. We've established a strong foundation in memory performance. Now, it's time to shift our focus from memory to the CPU. An app that is memory-efficient but freezes or stutters is still a poor experience.
Today's lesson addresses a critical aspect of app responsiveness. Our learning outcome is to use the Instruments Time Profiler to identify and diagnose CPU bottlenecks on the main thread. You will learn how to find the exact lines of code that are making your UI unresponsive and understand the strategies to fix them.
1. The Main Thread and the Perception of "Instant"
Before we open Instruments, it's crucial to understand why some operations cause the UI to freeze. In iOS, all user interface updates and user event handling (like taps and scrolls) happen on a single, dedicated thread: the main thread.
If you perform a long-running, CPU-intensive task on this thread—like complex data processing, loading a large file, or a poorly optimized algorithm—the main thread becomes "busy." It cannot process UI updates or respond to user touches until that task is complete. The result is a frozen UI, or what we call a "hang."
So, how fast does an interaction need to be to feel "instant"? This is a question of human perception.
WWDC23: Analyze hangs with Instruments | Apple
Let's start with this excellent explanation from Apple's WWDC23 session, 'Analyze hangs with Instruments.' It provides the foundational theory on why main thread responsiveness is so critical, covering human perception thresholds and the event-handling loop.
Please watch the first 9 minutes and 15 seconds (00:00 to 09:15). Pay close attention to: The thresholds for what feels 'instant' (around 100ms). The concept of the event handling and rendering loop. Why long-running work on the main thread blocks this loop and causes hangs.
The key takeaway is this: to maintain a fluid user experience, any work on the main thread should ideally complete in well under 100 milliseconds. For anything that takes longer, we need a strategy to avoid blocking the UI. Our first step is to find that time-consuming work.
2. Finding the Bottleneck with Time Profiler
The Time Profiler is the primary instrument for investigating CPU usage. It works by periodically taking a "snapshot" of the call stack (the sequence of functions currently being executed) on each thread. By aggregating thousands of these samples, it builds a statistical picture of where your app is spending most of its time.
A high concentration of samples in a particular function on the main thread is a strong indicator of a CPU bottleneck.
A Practical Demonstration
Let's watch a complete workflow of using the Time Profiler to find and analyze a "busy main thread" hang.
WWDC23: Analyze hangs with Instruments | Apple
Continuing with the 'Analyze hangs with Instruments' session, this segment demonstrates a full debugging cycle. You'll see how to record a hang, isolate it, and use the Time Profiler to pinpoint the problematic code.
Please watch from 9:15 to 16:03. Focus on this workflow: Recording: Starting the profiler and reproducing the hang in the app. Inspection: How Instruments automatically highlights the 'Severe Hang' and how to set the inspection range to focus on it. Analysis: Selecting the 'Main Thread' track and observing the high CPU usage during the hang. Drilling Down: Using the 'Heaviest Stack Trace' to quickly find the most time-consuming function calls.
3. The Core Profiling Workflow
The video you just watched demonstrates a standard, repeatable workflow for diagnosing CPU bottlenecks. Let's break it down into clear steps.
Step 1: Profile with the Right Configuration
Before you even start recording, ensure your setup is correct for gathering realistic performance data.
- Launch from Xcode: Use the Product ▸ Profile menu item (or
Cmd + I). - Use a Release Build: The Profile action in your scheme should use the 'Release' build configuration. Debug builds contain extra overhead and lack optimizations, giving you misleading performance data.
- Profile on a Real Device: The simulator runs on your Mac's powerful CPU. Performance issues that are severe on an older iPhone might be unnoticeable in the simulator. Always profile on a physical device, preferably a lower-end model if you have one.
Step 2: Record and Isolate the Hang
Start recording in Instruments with the Time Profiler template. Perform the action in your app that causes the stutter or hang. Once you've captured it, stop the recording.
Instruments will often automatically flag the hang with a red marker. To focus your analysis, Option-click the hang indicator and choose Set Inspection Range and Zoom. This filters all the data in the detail view to just that period of unresponsiveness.
Step 3: Analyze the Call Tree
With the hang isolated, the real investigation begins in the detail pane at the bottom.
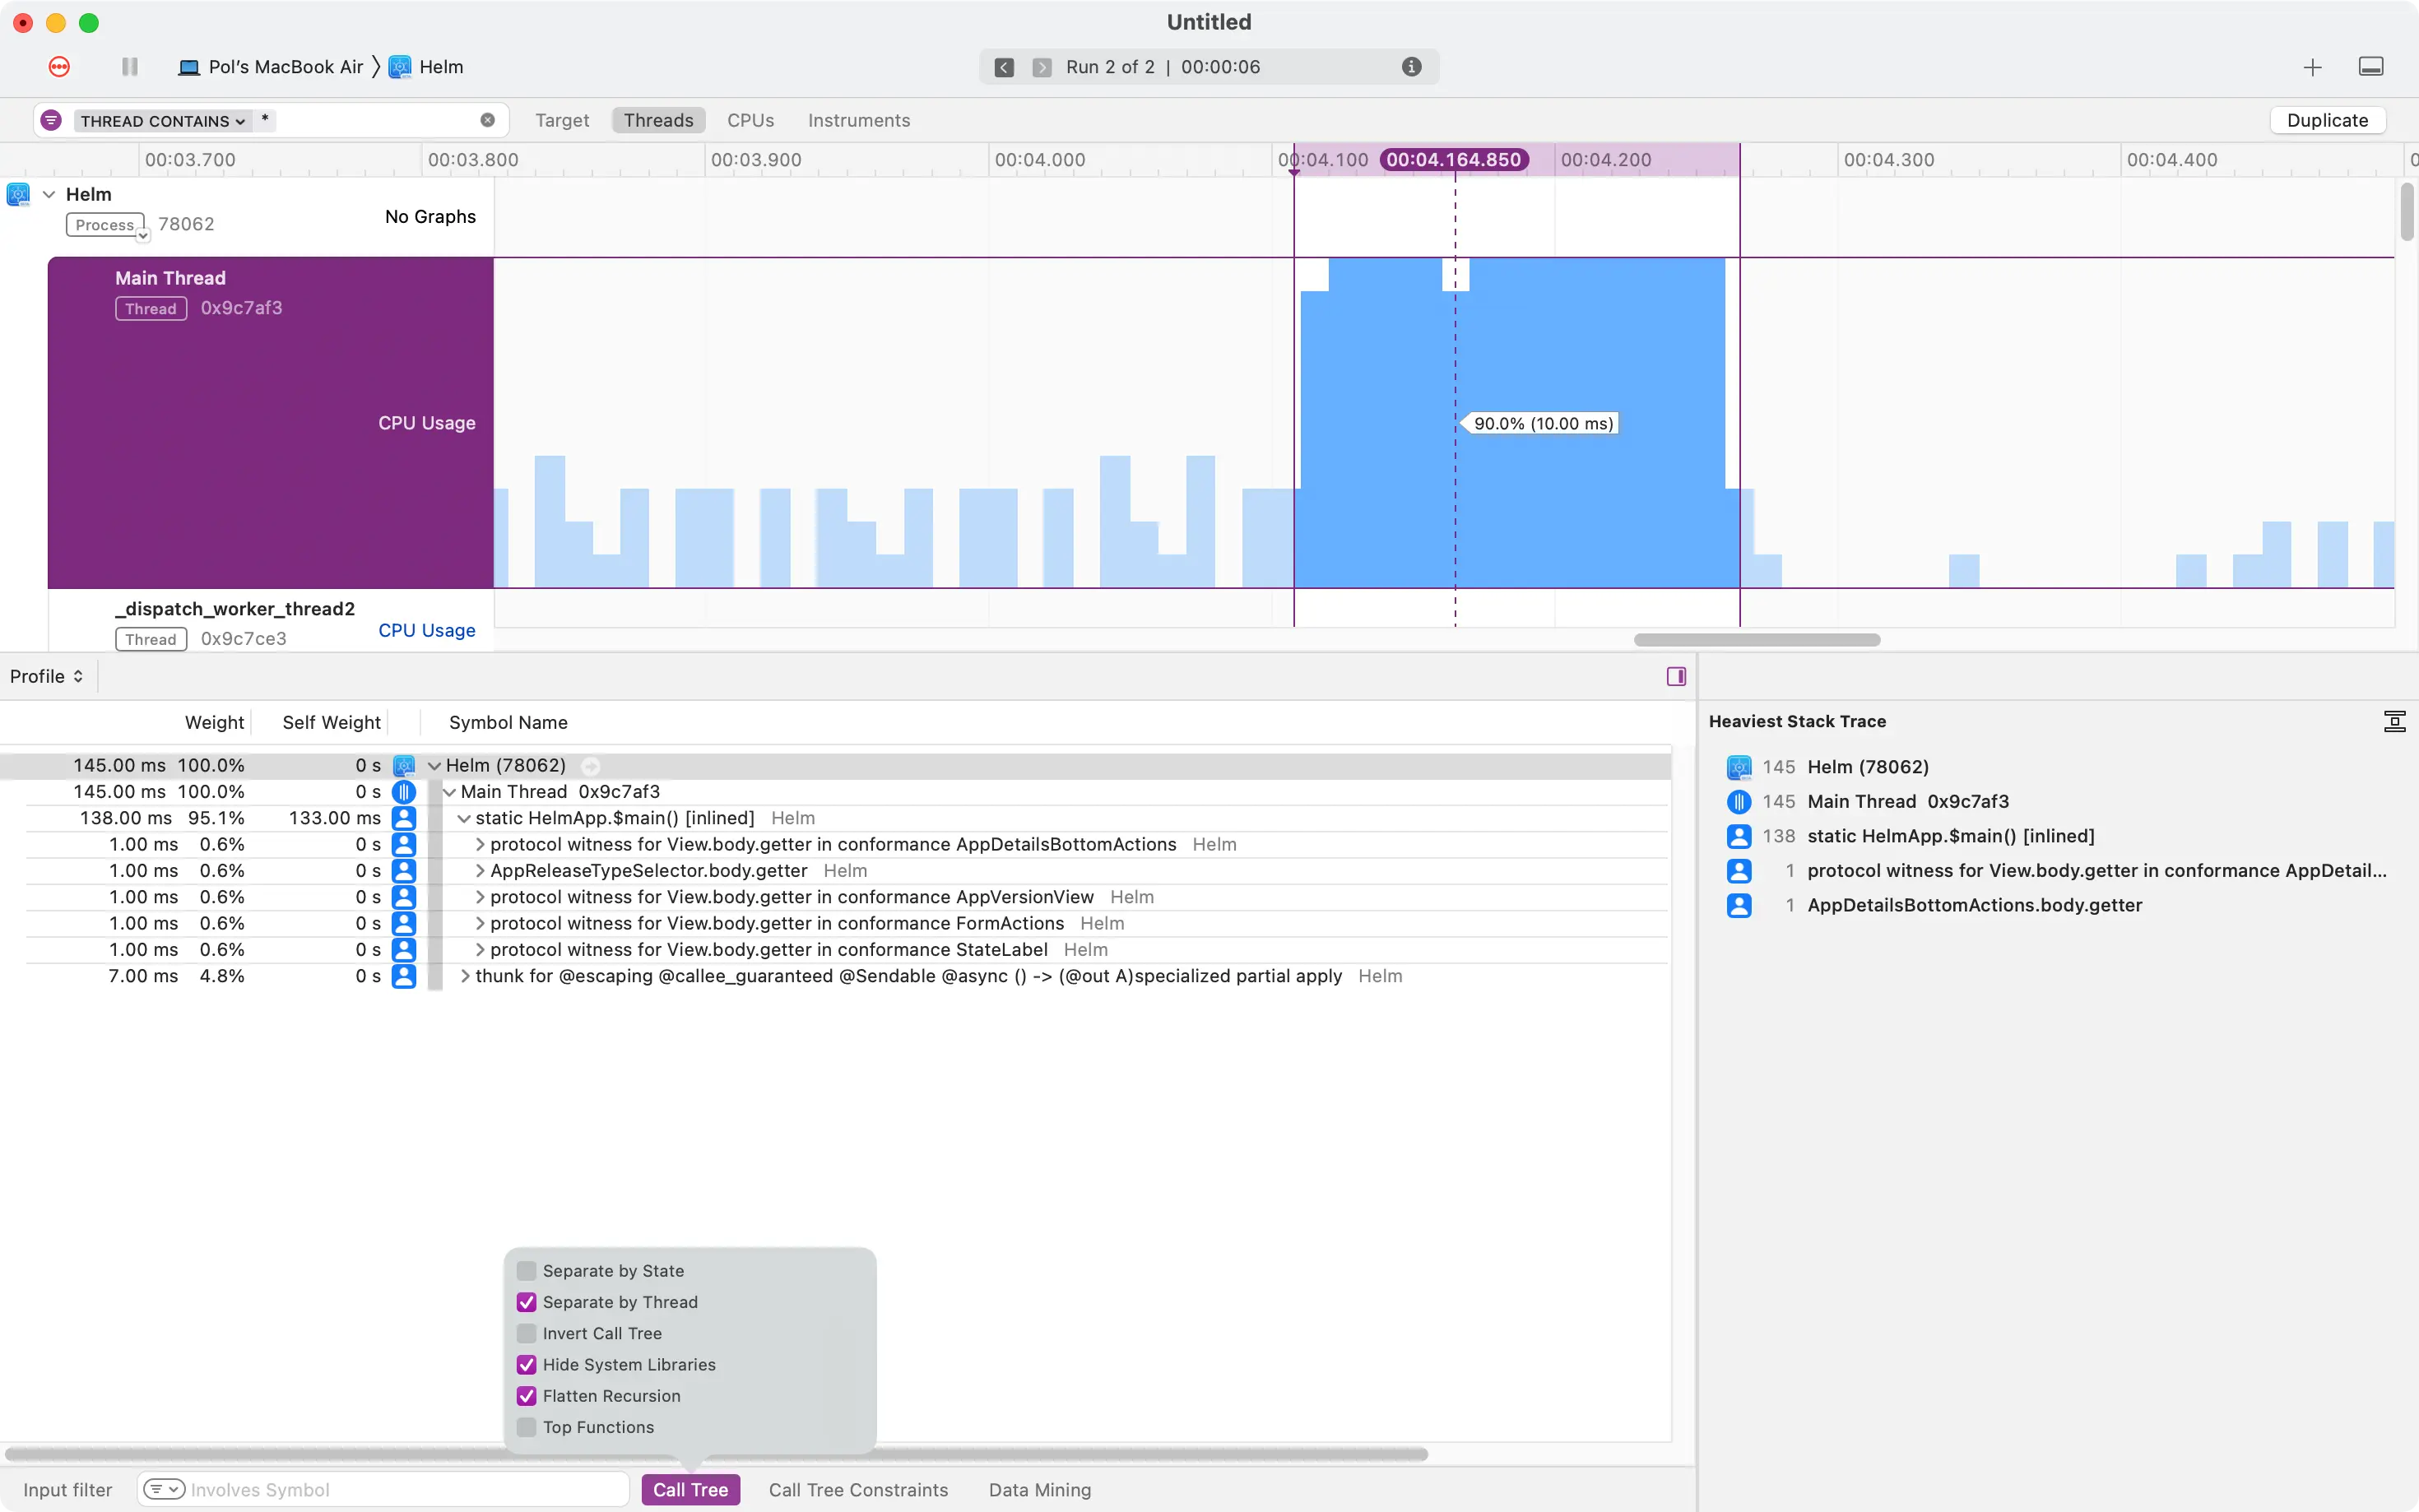
- Select the Main Thread: In the track view, expand your app's process and select the "Main Thread" track.
- Check CPU Usage: Look at the CPU graph for the main thread during the hang. If it's consistently high (e.g., >90%), you have a "busy" main thread. This is our focus today.
- Use the Call Tree: The detail view shows the call tree. This can be overwhelming. To narrow it down, use these essential settings in the "Call Tree" dropdown at the bottom:
- Invert Call Tree: This shows the most deeply nested functions (the "leaves" of the tree) at the top, which is often where the actual work is being done.
- Hide System Libraries: This filters out all the framework code (UIKit, Foundation, etc.) and shows only symbols from your app's code, making it much easier to find your own functions.
With these filters, the functions at the top of the list, sorted by "Weight," are your primary suspects. The Heaviest Stack Trace on the right-hand side gives you the most common path to that expensive function. Double-clicking a function in this list will take you directly to the source code in Xcode.
Test your understanding!
You are profiling your app and find a 1-second hang. After selecting the main thread and the hang interval, you look at the Call Tree. You see that 95% of the "Weight" is in a function called generateComplexReport(). When you "Hide System Libraries," this function is still at the top. When you disable that filter, you see that generateComplexReport() is calling many system functions related to string manipulation and data formatting.
What does this tell you about the cause of the hang?
Show answer
This tells you that the hang is caused by CPU-intensive work happening directly within your app's code, specifically in the generateComplexReport() function. The fact that it remains the "heaviest" function even with system libraries hidden confirms that the bottleneck originates in your own logic. The system functions it calls are merely the tools it's using to perform its slow task. The problem isn't a bug in the system frameworks; it's that your function is doing too much synchronous work on the main thread.
4. Fixing the Bottleneck
Once you've identified the slow function, there are generally two paths to a solution:
- Do Less Work: Can the operation be made more efficient? Perhaps you are using a slow algorithm (e.g., O(n²)) where a faster one exists. Or maybe you're doing redundant work inside a loop that could be done once outside of it. The
LazyVGridexample from the WWDC video (LINK, section 2) is a perfect illustration of this—by switching to a "lazy" container, the app avoids creating views that aren't on screen. - Move Work to a Background Thread: If the work is inherently long-running (like parsing large data, performing complex calculations, or I/O operations), it should not be on the main thread. The correct approach is to execute it asynchronously on a background thread and then, once it's complete, dispatch back to the main thread to update the UI with the result.
The WWDC23 video showed a fix using Swift Concurrency's .task modifier. This is the modern, preferred way to handle asynchronous work in SwiftUI.
WWDC23: Analyze hangs with Instruments | Apple
Let's watch the resolution from the WWDC23 video. This section demonstrates moving the thumbnail generation to a background task, which not only fixes the hang but also improves overall performance by running tasks in parallel.
Please watch from 23:16 to 35:57. This is a longer segment, but it's rich with insights. Observe: How they attempt a fix with .task but initially run into a new problem (an 'asynchronous hang'). How they use the Swift Concurrency Tasks instrument to realize the work is still on the main thread. The final fix: making the model's thumbnail property async to allow the work to correctly run on a background thread. The end result: a responsive UI and faster overall processing due to parallelism.
This example brilliantly sets the stage for our next topic. We have now seen why we need to move work off the main thread and what a performant result looks like.
Conclusion
Today, you've learned the essential skill of profiling your app's CPU performance to ensure a responsive UI. You can now methodically find and diagnose performance bottlenecks that cause your app to hang.
Key Takeaways:
- The main thread is for UI updates and event handling; long-running tasks on this thread cause the UI to freeze.
- The Time Profiler is your primary tool for finding CPU bottlenecks by sampling call stacks.
- The core workflow is: Profile on a real device with a Release build → Record and isolate the hang → Analyze the Main Thread's Call Tree using filters → Find the heaviest stack trace.
- A "busy" main thread has high CPU usage during a hang.
- Solutions involve either optimizing the code (do less work) or moving the work to a background thread.
Preview of the Next Lesson:
We've identified that moving expensive work off the main thread is a critical strategy for fixing hangs. In our next lesson, we will dive deep into this topic and apply modern Swift Concurrency (async/await) to move expensive operations off the main thread, learning the syntax and patterns to write clean, efficient, and responsive asynchronous code.