Hello! Welcome back to your training in professional iOS development.
In our last lesson, we focused on finding and fixing memory leaks—specifically retain cycles—using the Memory Graph Debugger. That's a crucial skill, but it only addresses one type of memory issue. An app can be completely free of leaks but still perform poorly or be terminated by the system if it uses too much memory at once.
Today, we'll broaden our scope from leaks to overall memory consumption. Our goal is to analyze app memory usage patterns and identify heavy allocations using the Allocations instrument. This tool helps you answer questions like:
- "Why does my app's memory usage spike when I open this screen?" (transient growth)
- "Why does my app's memory keep growing slowly over time?" (persistent growth)
- "What specific objects and code paths are using the most memory?"
This lesson will equip you with the skills to profile your app's memory footprint, ensuring it's not just leak-free, but also efficient.
1. The Allocations Instrument: Your Memory Profiling Hub
While the Memory Graph Debugger gives you a static snapshot of object relationships, the Allocations instrument provides a dynamic, timeline-based view of all memory allocations and deallocations (malloc and free) as they happen.
To get a formal introduction to the tool and its capabilities, let's start with Apple's official documentation.
Gathering information about memory use
The Apple Developer article 'Gathering information about memory use' provides a concise overview of the tools available for memory analysis. We'll focus on the section that introduces the Allocations instrument.
Please read the section titled 'Profile your app using the Allocations instrument'. Pay close attention to its description of the timeline, the statistics view, and the 'Generations' feature, which we'll be using later.
As you've just read, the Allocations instrument allows you to see memory usage over time and drill down into what's being allocated.
2. Case Study 1: Investigating Transient Memory Spikes
One of the most common issues you'll track is transient memory growth—a large, temporary spike in memory usage. Even though the memory is eventually released, a large enough spike can cause the system to terminate other apps or even your own. These often happen inside loops where many temporary objects are created.
Let's watch how Apple engineers diagnose and fix such a spike in a real-world scenario.
WWDC24: Analyze heap memory | Apple
In this segment from the WWDC24 session 'Analyze Heap Memory', we'll see a practical demonstration of using the Allocations instrument to find the cause of a massive memory spike when loading a gallery of images.
Please watch from 05:29 to 13:12. Focus on these key steps in the debugging workflow: Recording: How they reproduce the spike while recording in Instruments. Inspection: How they select the spike in the timeline to filter the data. Analysis: How they switch to the 'Call Tree' view and identify the 'heaviest stack trace'. The Cause: Their diagnosis of the autoreleasepool issue within a loop. The Fix: The simple code change that resolves the spike.
Workflow for Analyzing Spikes
The video demonstrates a powerful and repeatable workflow:
- Profile the Action: Start recording in Instruments (
Cmd + I) and perform the action that causes the memory spike. - Isolate the Spike: In the Allocations timeline, click and drag to select the time range corresponding to the spike. This filters all the detail views to show only what happened in that interval.
- Switch to Call Tree View: In the detail pane at the bottom, change the view from "Statistics" to "Call Trees". This groups allocations by the function call stacks that created them.
- Identify the Heaviest Stack Trace: The call tree is sorted by memory usage. The top entries, especially under "Heaviest Stack Trace" on the right, point directly to the most memory-intensive code paths. Your own app's code will be in bold.
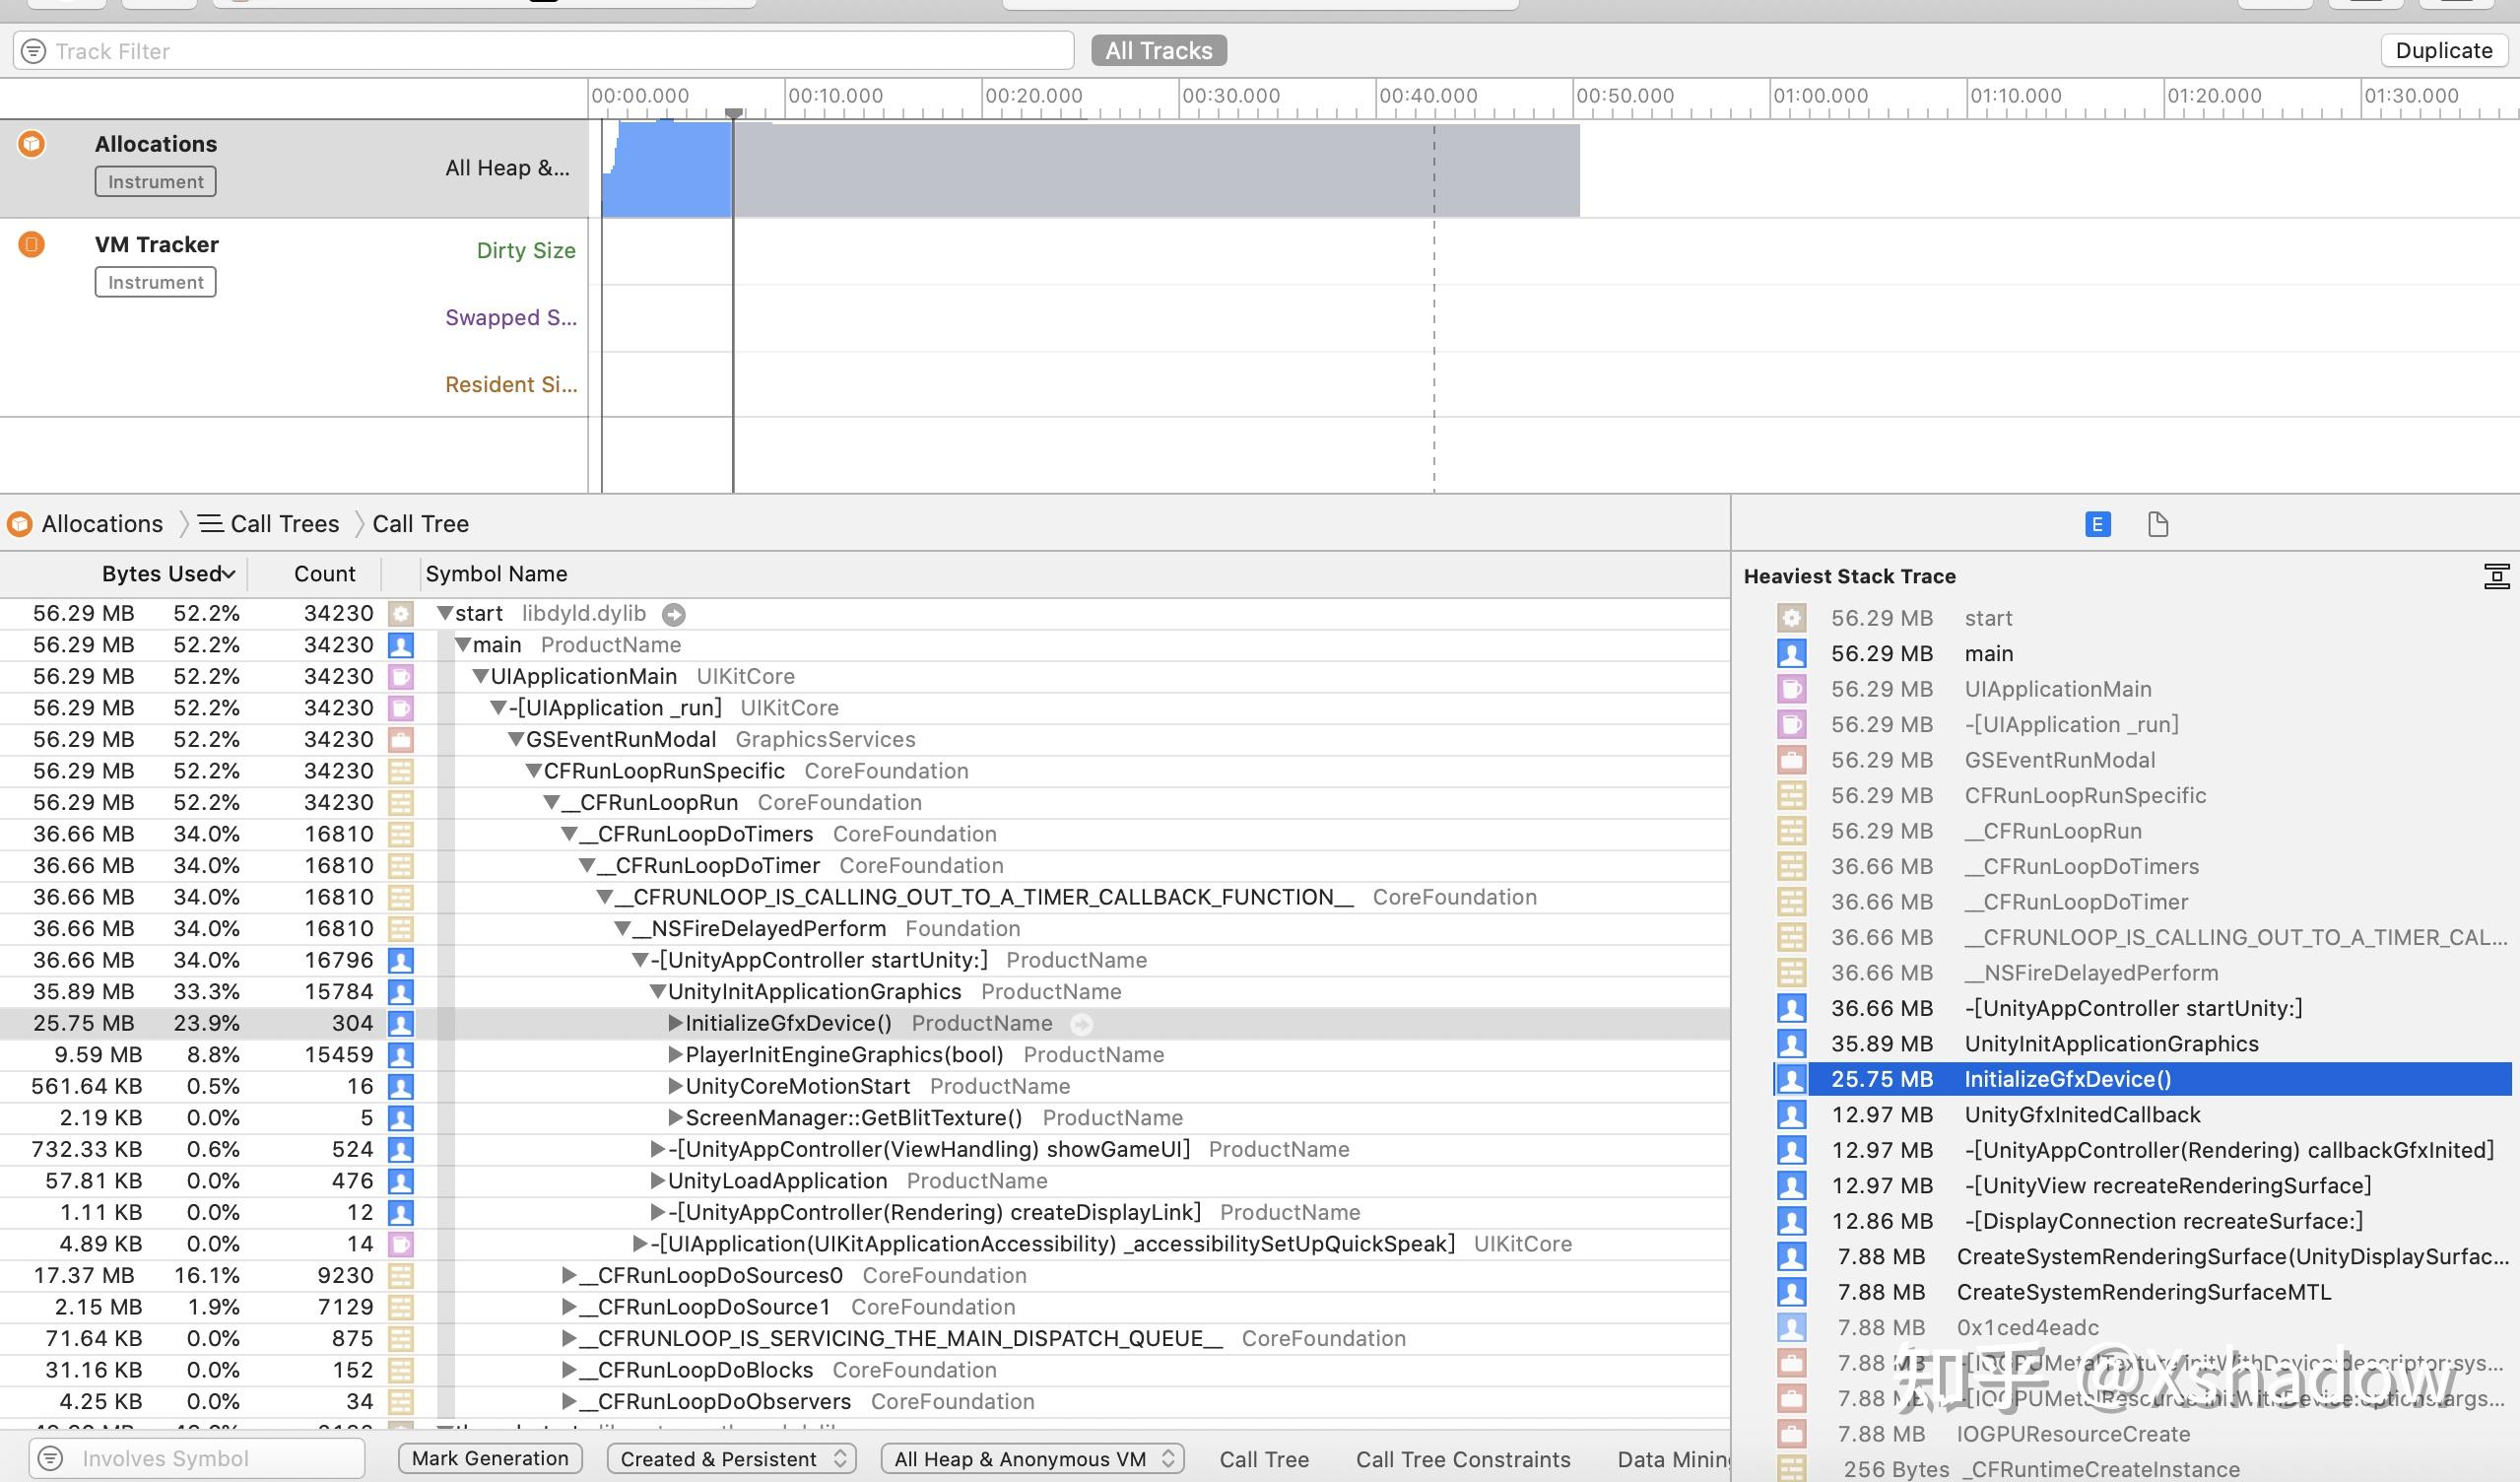
In the video's example, the root cause was that many temporary objects created inside a loop were being kept alive by an autoreleasepool that only drained after the loop finished. By wrapping the loop's body in its own autoreleasepool { ... }, the temporary objects were deallocated on each iteration, eliminating the spike.
3. Case Study 2: Tracking Persistent Memory Growth
Another common problem is persistent memory growth, where the memory footprint grows and never comes back down. This often looks like a "stair-step" pattern in the memory graph. It might be a bug in a cache or any situation where objects are being held onto unintentionally.
For this, the Mark Generation feature is indispensable. It lets you create checkpoints in time to see exactly what memory was allocated between two points.
Let's return to the WWDC video to see this in action. The engineers have fixed the spike, but now notice a new stair-step pattern.
WWDC24: Analyze heap memory | Apple
This next segment of 'Analyze Heap Memory' shows how to use the 'Mark Generation' feature to diagnose the stair-step growth pattern.
Please watch from 13:12 to 19:58. Notice how they: Use the 'Mark Generation' button between each time they open the gallery. Inspect the 'Growth' column for the newly created generations to see what objects are persisting. Identify a bug in their caching logic that was causing new objects to be cached every time instead of being reused.
Workflow for Analyzing Persistent Growth
- Get to a Baseline: Run the app and navigate to the screen just before the action you want to test.
- Mark Generation: Click the "Mark Generation" button in Instruments. This creates Generation A.
- Perform the Action: Perform the action once (e.g., open and close a view).
- Mark Again: Click "Mark Generation" again. This creates Generation B, which contains all the objects that were allocated and persisted since you marked Generation A.
- Inspect the Generation: Expand the new generation in the statistics view and sort by size or growth. This shows you exactly which objects were created by your action and never got deallocated.
This technique is incredibly effective for isolating memory growth caused by specific features. In the video, it led them straight to a faulty cache key that was causing thumbnails to be re-cached on every view.
Test your understanding!
You are profiling your app.
- Scenario A: When you open a photo editor, memory usage jumps by 500 MB, but returns to normal after you close it.
- Scenario B: Every time you open and close a user's profile page, the app's total memory usage increases by 5 MB and stays there.
Which analysis technique would you primarily use for each scenario? (e.g., "Analyze a spike in the timeline" or "Use Mark Generation").
Show answer
-
Scenario A is a classic transient memory spike. The best approach is to select the spike in the Allocations timeline and use the Call Tree view to find the heaviest stack trace responsible for the temporary 500 MB allocation.
-
Scenario B is persistent memory growth. The best approach is to use the Mark Generation feature. You would mark a generation, open/close the profile, mark another generation, and then inspect the new generation to see what 5 MB of objects were created and not released.
4. A Common Pitfall: Wasted UITableViewCell Allocations
The examples from Apple are excellent, but let's apply these concepts to one of the most common performance issues in iOS history: failing to reuse table view cells. This is a perfect example of unnecessary transient allocations that can make scrolling feel sluggish.
We'll use a short, focused video to see how the Allocations instrument makes this problem obvious.
Fixing the bugs: wasted allocations – Instruments, part 5
In this video 'Fixing the bugs: wasted allocations' from Paul Hudson, we'll see a clear 'before and after' of optimizing table view cell allocation.
Please watch the following three clips: The Problem (0:36 - 2:25): Watch how scrolling creates hundreds of 'transient' UITableViewCell objects. 'Transient' means they were created and destroyed. This is the sign of inefficiency. The Cause (2:25 - 3:04): He quickly shows the code that is creating a new cell every single time instead of dequeuing one. The Verification (6:46 - 7:47): After applying the fix, he re-runs Instruments. Notice that the number of transient cells is now zero, proving the cells are being reused correctly.
This example powerfully demonstrates how the "Transient" count in the Allocations instrument can be a key indicator of inefficiency. High transient counts for expensive objects like views often mean you are recreating things that you should be reusing.
Conclusion
You have now added the Allocations instrument to your memory debugging toolkit. You've moved beyond just finding leaks with the Memory Graph Debugger to analyzing your app's broader memory consumption patterns.
Key Takeaways:
- The Allocations instrument is used to analyze dynamic memory usage, including both temporary spikes and persistent growth.
- To analyze transient spikes, select the spike in the timeline and use the Call Tree view to find the heaviest stack trace.
- To analyze persistent growth (stair-step patterns), use the Mark Generation feature to isolate allocations between specific user actions.
- Pay attention to both the
Sizeof allocations and theTransientcount, as high churn can also indicate performance problems.
Preview of the Next Lesson:
We've now covered memory leaks and memory consumption, two pillars of memory performance. However, a responsive app isn't just memory-efficient; it also needs to be CPU-efficient. In our next lesson, we will shift our focus from memory to the processor and learn how to use the Instruments Time Profiler to identify and diagnose CPU bottlenecks on the main thread.