Welcome back. In our previous lesson, you delved into the heart of PyTorch's automatic differentiation engine by implementing a custom autograd.Function. That exercise gave you a deep appreciation for how gradients are computed and propagated, a foundational skill for designing novel model components.
Today, we shift our focus from the mechanics of a single operation to the architecture of a problem. We will address how to prepare data for a class of models designed to understand time and order: Recurrent Neural Networks (RNNs). Your goal for this lesson is to master the art of modeling a simple time-series forecasting problem by defining the precise input and output data structures a recurrent model requires. This is a crucial data engineering step that precedes building the complex sequential models, like Transformers, that are central to your roadmap.
1. The Challenge of Sequential Data
Standard feedforward networks, like the perceptrons we've discussed, treat each input as an independent event. However, in time-series data—like stock prices, weather patterns, or sensor readings—the order of events is paramount. The value at time is often dependent on the values at . To capture these temporal dependencies, we need a new kind of architecture.
Recurrent Neural Networks (RNNs) solve this by introducing a "memory" or an internal state, typically denoted as . This state is updated at each time step and carries information from the past into the present computation.
MIT 6.S191: Recurrent Neural Networks, Transformers, and Attention
To build a strong intuition for this, watch this segment from an MIT lecture on Recurrent Neural Networks. It masterfully explains why sequential data requires a different approach and introduces the core concept of a recurrence relation.
Watch from the beginning of the lecture to the introduction of the recurrence relation, specifically the segment from motivation to recurrence. Pay close attention to how the lecturer evolves a simple perceptron into a recurrent model by adding an internal state, h_t, that connects computations across time steps.
The key insight is the recurrence relation:
The state at the current time step, , is a function of both the current input and the previous state . This simple loop is what gives RNNs their ability to "remember" and process sequences.
2. Framing the Forecasting Problem
Before we can feed data into an RNN, we must structure it in a way the model can understand. This involves framing our time series task into a supervised learning problem with clear inputs (X) and targets (y). The way we do this depends on the specific question we're asking.
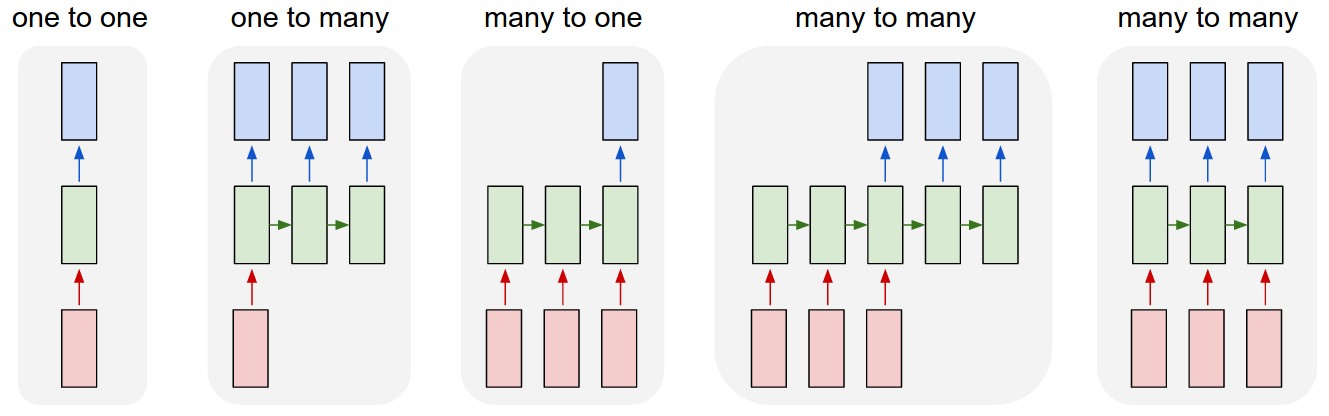
- Many-to-One: We use a sequence of past values to predict a single future value. For example, using the last 30 days of a stock's price to predict tomorrow's price.
- Many-to-Many: We use a sequence of past values to predict a sequence of future values. For example, using the last week's weather data to predict the forecast for the next three days.
The fundamental technique for creating these structures is the sliding window or lookback method.
3. The Sliding Window: Creating Input/Output Pairs
The "lookback" defines how many previous time steps the model gets to see to make a prediction. We slide this window across our time series to generate multiple input-output samples.
A fantastic article from Machine Learning Mastery demonstrates this with a classic dataset: predicting airline passenger numbers. The core logic is encapsulated in a single, powerful function.
LSTM for Time Series Prediction in PyTorch
This article provides a clear, code-driven explanation of how to prepare time-series data. It uses a real dataset and builds the exact data preparation function you need to understand.
First, read the section on the airline passengers problem to understand the dataset. Then, focus intently on the next section that defines the create_dataset function. Analyze this Python function line-by-line. How does it use the lookback parameter to create feature and target sequences from a flat list of numbers? Finally, examine the output shapes shown right after the code block.
Let's trace the logic with a simple example. Imagine our time series is [10, 20, 30, 40, 50, 60] and we set lookback = 3. The create_dataset function would generate the following pairs:
- Input
X:[10, 20, 30], Targety:[20, 30, 40] - Input
X:[20, 30, 40], Targety:[30, 40, 50] - Input
X:[30, 40, 50], Targety:[40, 50, 60]
The function from the article creates input and target sequences of the same length. This is a common setup for a "many-to-many" task where the model learns to predict the next value at each time step. The final prediction we care about for forecasting is often the last element of the output sequence.
The result is a dataset where each sample X is a sequence of length lookback, and each y is the corresponding future sequence. When batched together, the input tensor X will have the shape (batch_size, sequence_length, num_features), which is exactly what PyTorch's recurrent layers expect when configured with batch_first=True.
4. A Concrete Implementation in PyTorch
Now let's see how this data structuring is implemented within a complete PyTorch workflow. The following article from Towards Data Science walks through building an LSTM to learn a sine wave, and its data preparation and forward pass logic are highly instructive.
Pytorch LSTMs for time-series data | Towards Data Science
This article demonstrates sequence-to-sequence forecasting. It shows how to structure inputs and targets to predict not just one, but multiple future steps.
Read the section titled "Training the model". Notice how train_input is defined as the first 999 points of each sequence, while train_target is the last 999 points (i.e., shifted by one step). This teaches the model to predict y[t] from x[t-1]. Then, review the section "Forward method". Focus on how the code iterates through the input sequence one step at a time, and then uses a separate loop to autoregressively generate future predictions by feeding the model's own output back as its next input. This is a key technique in forecasting.
This approach demonstrates two key ideas:
- Teacher Forcing during Training: By providing the full input and target sequences (
y[:, :-1]andy[:, 1:]), we are "forcing" the model at each step with the correct ground-truth value from the previous step. This stabilizes training. - Autoregressive Generation during Inference: To predict the future, the model uses its own prediction for time as part of the input to predict time .
5. Integrating with PyTorch's Dataset and DataLoader
The final step is to wrap this data generation logic in a PyTorch Dataset class. This allows PyTorch's DataLoader to efficiently handle batching, shuffling, and parallel data loading.
PyTorch DataLoader Explained: How to make Basic and Custom Datasets
This video provides a practical guide to creating custom PyTorch Dataset classes, specifically for time-series data.
Watch the segment from creating a basic time series dataset. The BasicTimeSeriesDataset class is a perfect example of what we've been discussing. Observe how the __init__ method stores the data and window size, __len__ calculates the total number of possible samples, and __getitem__ is responsible for slicing and returning a single (input_window, target) pair based on an index.
Using a custom Dataset makes your code modular and clean. The logic for creating windows is contained within the dataset, and your training loop simply iterates over the DataLoader.
6. An Expert Distinction: Evaluation vs. True Forecasting
As you move towards a senior engineering role, it's vital to understand a subtle but critical distinction in how time-series models are evaluated. The code in the Machine Learning Mastery article plots model(X_test). A sharp reader pointed out a potential issue with this, leading to an excellent clarification.
LSTM for Time Series Prediction in PyTorch
This discussion in the comments section of the article is invaluable. It separates standard model evaluation from true, real-world forecasting.
Read the exchange beginning with Manel's question: "Hi, I think I’m a bit confused." The response clarifies the difference between: Evaluating on known test data (teacher-forcing): Using X_test to generate predictions measures the model's performance on one-step-ahead predictions given a perfect history. This is a standard evaluation metric. Autoregressive forecasting: Taking the last known data, predicting one step, and then feeding that prediction back into the model to predict the next step. This simulates a real-world scenario where the future is truly unknown and is a much harder task due to error accumulation.
Understanding this difference is what separates a practitioner who can train a model from an engineer who can deploy a reliable forecasting system. Your approach to evaluation must match the intended use case.
Conclusion
In this lesson, you've learned the fundamental principles of preparing data for recurrent models. This is a non-trivial but essential step in the pipeline for any sequential task.
Key Takeaways:
- Time-series forecasting requires structuring a flat sequence of data into input/output pairs using a sliding window (or "lookback") method.
- The shape of your problem—predicting one step (
many-to-one) or many steps (many-to-many)—determines how you define your target sequences. - The standard tensor format for PyTorch recurrent layers is
(batch_size, sequence_length, num_features). - PyTorch's
Datasetclass is the ideal place to implement your windowing logic, keeping your data preparation modular and efficient. - There is a critical difference between evaluating a model with ground-truth inputs (
teacher forcing) and simulating real-world autoregressive forecasting, where the model relies on its own past predictions.
We've focused on how to structure data for models that read sequences. In the next lesson, we will pivot to a different type of data and architecture by exploring the mechanics of the 2D convolution operation, the workhorse behind models that "see" grid-like data such as images.