Introduction
In our last lesson, we established a solid understanding of what Gross Domestic Product (GDP) represents and why the distinction between its nominal and real values is crucial for measuring an economy's true growth. We now know what we are trying to measure. Today, we shift our focus to how this measurement is practically done.
The learning outcome for this session is to explain the three methods of calculating national income: the Product (Value Added) Method, the Income Method, and the Expenditure Method. You will learn that an economy's total production, total income, and total expenditure are three sides of the same coin. Understanding these three approaches will give you a multi-faceted view of the economy's structure, a perspective that is essential for interpreting economic data and policy documents from institutions like the RBI.
The Circular Flow: A Unifying Framework
Before diving into the specific methods, it's helpful to have a mental model of how an economy functions. The core idea is that economic activity is a circular flow. Firms produce goods and services, which generates income for households (in the form of wages, rent, interest, and profit). Households then use this income to spend on the goods and services produced by firms.
Therefore, we can measure the total economic activity in three ways:
- By measuring the total value of production (what is made).
- By measuring the total income generated from that production (what is earned).
- By measuring the total expenditure on those final goods and services (what is spent).
Theoretically, all three methods should yield the same result. The following video provides a quick and clear overview of this principle.
GDP and the Circular Flow- Macro Topic 2.1
This video by Jacob Clifford introduces the three methods as different ways of looking at the same economic activity, using a simple example to show how they all lead to the same GDP figure.
Start by watching the introduction to GDP and the three measurement methods. Then, watch the explanations for the expenditures approach and the income approach. Finally, observe how the simple hat example demonstrates that all three approaches (expenditure, income, and value-added) result in the same GDP value of $10.
Now, let's explore each method in detail.
Method 1: The Product or Value-Added Method
This method focuses on the production side of the economy. A naive approach would be to sum the market value of everything produced. However, as we noted in the last lesson, this would lead to massive double-counting. For instance, if we counted the value of steel and also the value of a car made from that steel, we'd be counting the steel twice.
The solution is to sum the value added at each stage of production. Value Added is simply the value of a firm's output minus the value of the intermediate goods it purchased to produce that output.
The following video provides an excellent, detailed walkthrough of this concept using a clear example that traces the production of a shirt from raw cotton. This illustrates why the value-added approach is a practical solution to a complex data collection problem.
How to Calculate GDP, GNP, NDP, NNP? | Indian Economy - Lecture 3 | UPSC NCERT Free Series
This video from PW OnlyIAS English explains the production method and the challenge of identifying final goods. Pay close attention to the cotton-to-shirt example, as it clearly demonstrates how summing the value added at each step avoids double-counting and equals the value of the final good.
Watch the segment from 10:16 to 18:48. This section introduces the output method, highlights the practical problem of distinguishing intermediate from final goods, and then masterfully explains the value-added solution.
The sum of the Gross Value Added (GVA) of all firms in the economy gives us the GVA at basic prices. To get to GDP at market prices, we need to add product taxes and subtract product subsidies. In India, the headline growth number is often presented in terms of GVA.
The following chart shows the sector-wise growth rates of Real GVA in India. This is a direct application of the Product Method, breaking down the economy's output by its main sectors: Agriculture, Industry, and Services.
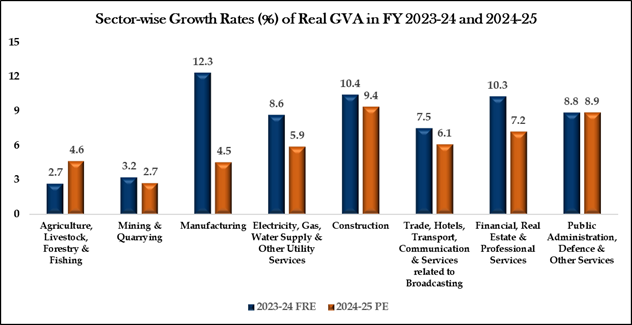
This bar chart displays the GVA growth rates for different sectors of the Indian economy, such as Agriculture, Manufacturing, and Services. The data is a direct result of applying the Value-Added method.
To consolidate the formulaic aspect of this method, the following reading provides a concise summary.
Three Methods of calculating National Income
This article from GeeksForGeeks clearly lays out the formula for the Value Added Method and provides a worked example.
Read the section on the Value Added Method. Focus on the formula NNPFC = GDPMP - Depreciation - Net Indirect Taxes + NFIA and the logic in the examples.
Method 2: The Income Method
This method approaches GDP calculation from the opposite side of the circular flow. It sums all the incomes earned by the factors of production (land, labor, capital, and entrepreneurship) in producing the nation's output. Every dollar of value produced must ultimately end up as someone's income.
The main components of national income under this method are:
- Compensation of Employees (COE): Wages, salaries, and benefits paid to workers.
- Operating Surplus: This is the income earned by capital and property. It includes:
- Rent
- Interest
- Profits (which are further divided into corporate taxes, dividends, and retained earnings).
- Mixed Income: This is the income of the self-employed (e.g., doctors, shop owners), where it's difficult to separate the income from labor and capital.
The sum of these three components gives us Net Domestic Product at Factor Cost (NDPfc). We can then make adjustments to arrive at GDP at market prices.
The PW OnlyIAS English video also explains this method clearly.
How to Calculate GDP, GNP, NDP, NNP? | Indian Economy - Lecture 3 | UPSC NCERT Free Series
The video now shifts to explain how the same economic value can be measured by summing the incomes distributed to factors of production.
Please watch the segment explaining the income method, from 18:52 to 21:35. Note the breakdown into wages, interest, rent, and profits.
For a quick reference on the components included and excluded under this method, the following reading is helpful.
Notes National Income Accounting
These notes from Anujjindal.in provide a structured breakdown of the Income Method, which is useful for exam preparation.
Read section 9.2, Income method. Pay attention to the definitions of Compensation of Employees, Operating Surplus, and Mixed Income.
Method 3: The Expenditure Method
The third and final method calculates GDP by summing the total spending on all final goods and services produced in the economy. This is perhaps the most famous representation of GDP.
The expenditure is categorized into four components, giving rise to the fundamental macroeconomic equation:
- C - Private Final Consumption Expenditure (PFCE): Spending by households on goods and services.
- I - Gross Fixed Capital Formation (GFCF) or Investment: Spending by firms on capital goods (machinery, buildings) and changes in inventories. Household spending on new housing is also included here.
- G - Government Final Consumption Expenditure (GFCE): Spending by the government on goods and services (e.g., defense, infrastructure, salaries for government employees). Note that this excludes transfer payments like pensions or unemployment benefits, as they don't represent production.
- (X - M) - Net Exports: Exports (X) are spending by foreigners on our goods and services, so they are added to our GDP. Imports (M) are our spending on foreign goods and services, so they must be subtracted.
Let's return to the PW OnlyIAS video for a detailed explanation of these components.
How to Calculate GDP, GNP, NDP, NNP? | Indian Economy - Lecture 3 | UPSC NCERT Free Series
This final segment explains the expenditure approach, breaking down spending by households, firms, the government, and the external sector.
Watch the section on the expenditure method from 21:36 to 26:17. Focus on understanding what C, I, G, and (X-M) represent.
This expenditure-based view is often used to analyze the "drivers" or "engines" of economic growth. The following table, based on recent Indian data, shows the contribution of each component to India's GDP.
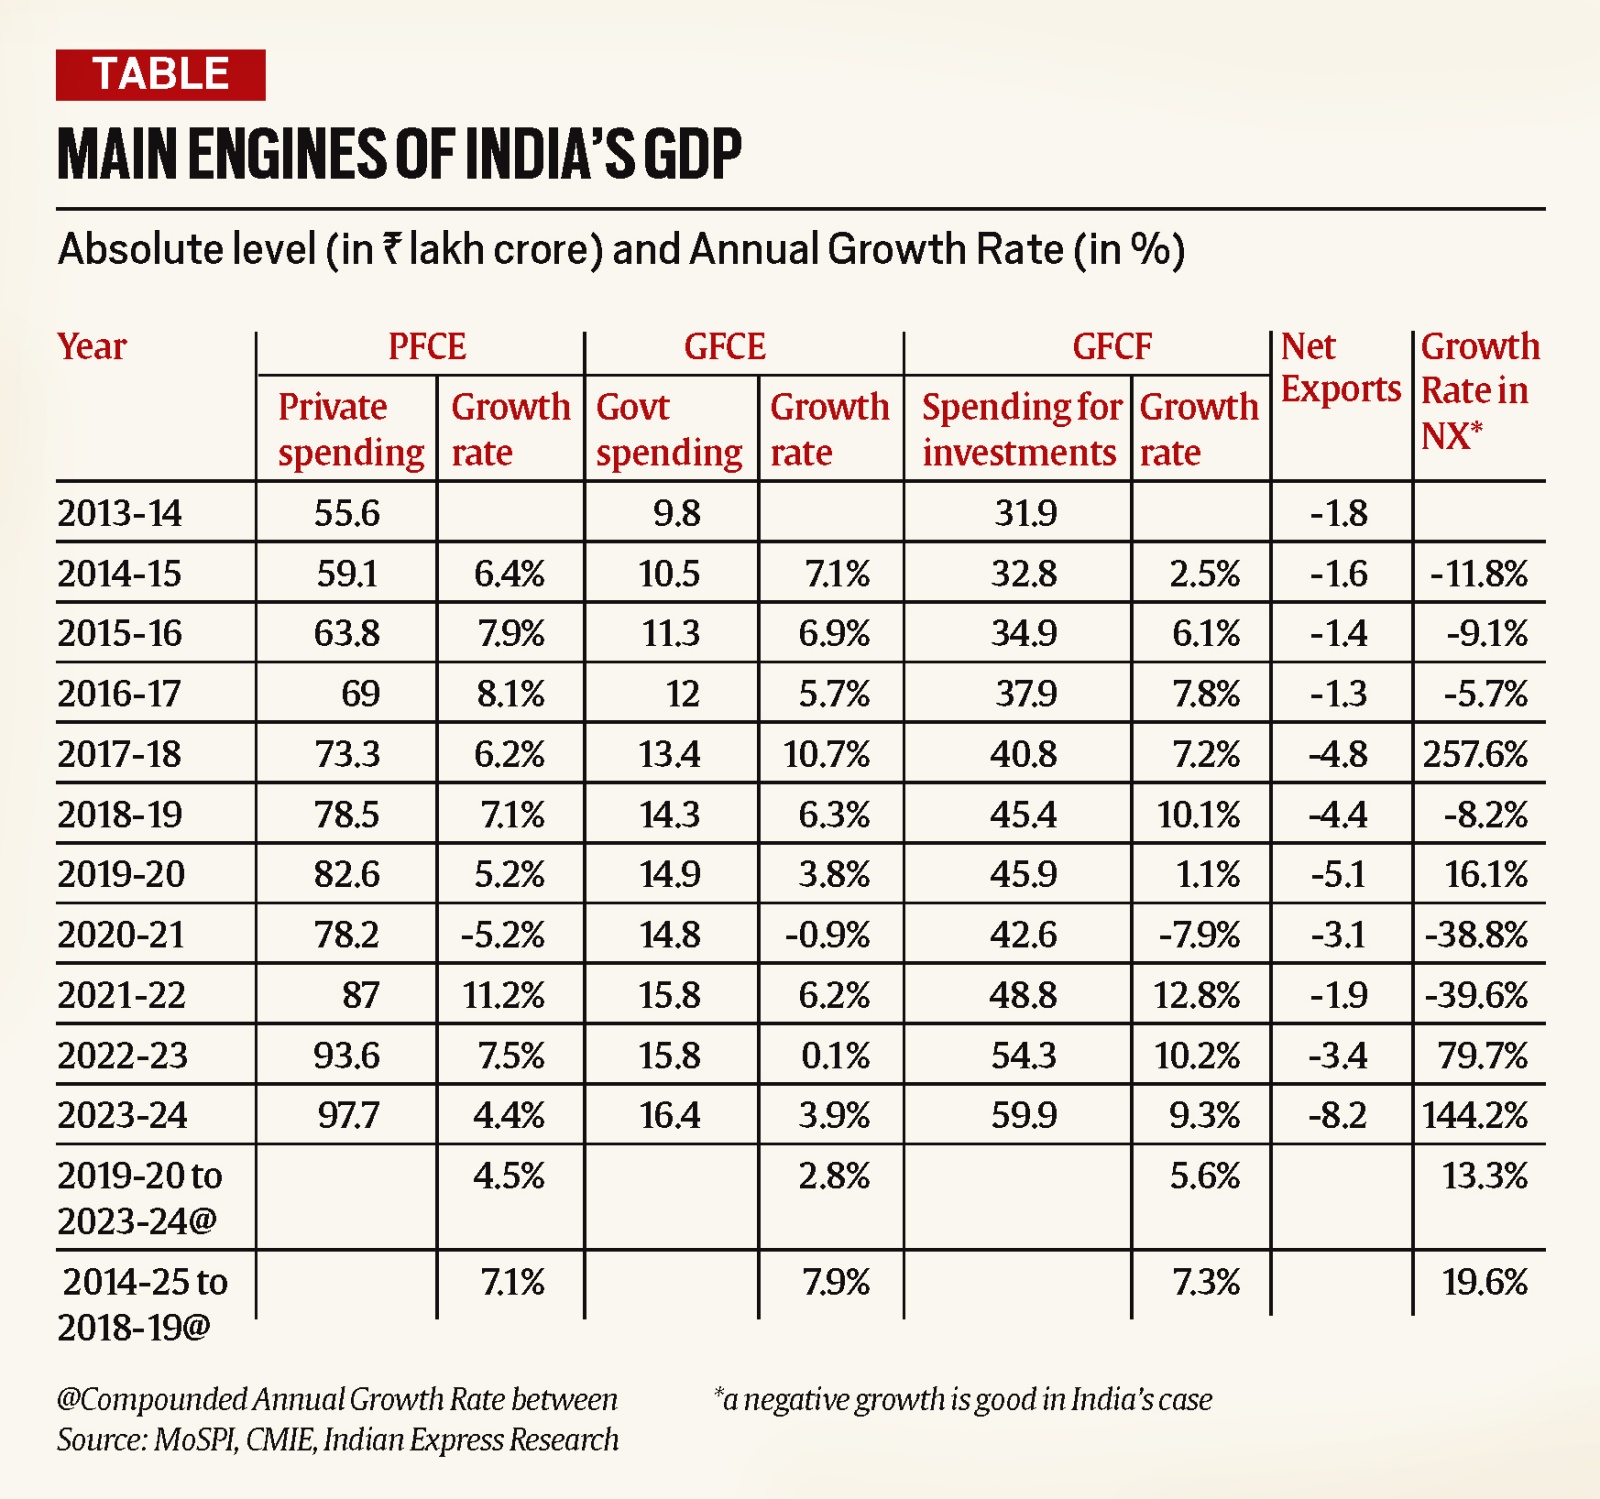
This table illustrates the expenditure method in action, showing the annual growth rates for Private spending (PFCE), Govt spending (GFCE), Investment (GFCF), and Net Exports for the Indian economy over several years.
As you can see, private consumption (PFCE) is the largest component of India's GDP, often referred to as the main engine of the economy. Fluctuations in investment (GFCF) are also watched closely as an indicator of business confidence.
Conclusion
Today, we've deconstructed the process of national income accounting into its three core methodologies. You've learned that whether we measure the value of what is produced, the income that is earned, or the money that is spent, we are fundamentally measuring the same flow of economic activity.
Here are the key takeaways:
- Product (Value-Added) Method: Calculates GDP by summing the value added at each stage of production. This is crucial to avoid double-counting intermediate goods. It gives a sectoral view of the economy.
- Income Method: Calculates GDP by summing all incomes earned—wages, rent, interest, and profits. This shows how the value created is distributed among the factors of production.
- Expenditure Method: Calculates GDP by summing total spending on final goods and services using the formula . This reveals the sources of demand in the economy.
With this lesson, you have a comprehensive understanding of how the headline GDP number is derived. In our next session, we will build on this foundation to explore other important national income aggregates like GNP, NNP, NDP, and Per Capita Income. These related concepts offer different lenses through which to assess a nation's economic well-being.