Hello! Welcome to your third lesson in the Social Media Marketing Foundations module.
In our last lesson, we established the "what" and "when" of social media by explaining the roles of a content strategy and a content calendar. You learned how to plan your posts to align with your business goals. But once you've executed your plan, how do you know if it's actually working?
This lesson answers that critical question. We'll be addressing the learning outcome: Define key social media performance metrics (e.g., engagement rate, reach, impressions).
Think of your social media posts as a treatment you're administering. Metrics are the clinical data that tell you if that treatment is effective. They provide objective, quantifiable feedback on your efforts, allowing you to understand what resonates with your audience, prove the value of your work, and make data-driven decisions to improve your strategy.
What are Social Media Metrics?
At its core, social media analytics is the process of gathering and analyzing data from social media platforms to help you make better business decisions. This data can be broken down into two main types:
- Qualitative data: Describes qualities or characteristics, like the tone and language people use when talking about your brand.
- Quantitative data: Information that can be measured numerically, like the number of likes on a post.
Social media metrics are the specific, quantifiable data points you track. To get a foundational understanding of what social media analytics involves and why it's so beneficial, let's watch a short introductory video.
Social media analytics and reporting | Google Digital Marketing & E-commerce Certificate
This video from the Google Career Certificates channel introduces the concept of social media analytics and explains how it helps you understand your audience, content performance, and competitors.
Please watch from 01:58 to 04:30. Focus on the definition of social media analytics and the different ways it can support your campaigns.
As the video highlighted, analytics allows you to measure your progress and refine your strategy. Now, let's dive into the specific metrics you'll be tracking.
Awareness Metrics: Are People Seeing Your Content?
The first and most fundamental goal of social media is often awareness: getting your content in front of people. The two most important metrics for measuring this are reach and impressions. They sound similar, but the difference is crucial.
- Impressions: The total number of times your content is displayed on a screen.
- Reach: The number of unique people who saw your content.
So, if one person sees your post three times, that counts as 3 impressions but only 1 reach.

To solidify this distinction, let's look at a clear written explanation.
Reach vs. Impressions: Understanding the Key Differences
This article from Mailchimp, a leading marketing platform, provides a fantastic breakdown of the difference between reach and impressions, complete with a simple, clear example.
Read the first two sections, 'What is the difference between reach and impressions?' and the example scenario involving User A, User B, and User C. This will make the distinction perfectly clear.
One key takeaway from the article is that your reach will always be less than or equal to your impressions.
It's also important to know that different platforms report these metrics in slightly different ways. The Mailchimp article you just read also has a section titled 'Understanding reach vs. impressions on different social media platforms' (section 1), which is a useful reference for the future. For now, just know that you should always check the specific definitions within the analytics section of the platform you are using (e.g., Meta Business Suite for Facebook/Instagram, or TikTok Studio).
Engagement Metrics: Are People Interacting With Your Content?
Seeing your content is one thing; interacting with it is another. Engagement measures any action someone takes on your post. This includes:
- Likes or Reactions (e.g., ❤️, 😂)
- Comments
- Shares or Retweets
- Saves
- Clicks (on a link, your profile, etc.)
While it's good to track these individual numbers, the most powerful engagement metric is the Engagement Rate. This metric puts the raw numbers into context by showing what percentage of your audience is interacting with your content.
Let's look at how to calculate it.
Social Media Metrics: All Types Explained [2025]
This article from Sprinklr provides a simple definition of engagement rate and the most common formula used to calculate it.
Read the section titled '1. Engagement rate' under 'Category 2: Social media engagement metrics.' Focus on the definition and the formula provided.
As the article explains, the most basic formula for engagement rate is:
For example, if you have 1,000 followers and a post gets 80 likes and 20 comments (100 total engagements), your engagement rate for that post is:
A high engagement rate is a strong signal that your content is valuable and relevant to your audience.
Test your understanding!
A local pharmacy's Instagram account has 5,000 followers. They post a video about the importance of skin protection, which gets:
- 8,000 impressions
- 6,000 reach
- 400 likes
- 50 comments
What is the engagement rate for this post based on the formula we just learned?
Show answer
First, calculate the total engagements: 400 likes + 50 comments = 450 engagements.
Next, use the formula:
The engagement rate for the post is 9%.
Connecting Metrics to Your Goals
Tracking metrics is not about collecting numbers for their own sake. The purpose is to measure your progress toward the goals you set in your content strategy.
This visual map is a great way to categorize metrics based on what they measure.
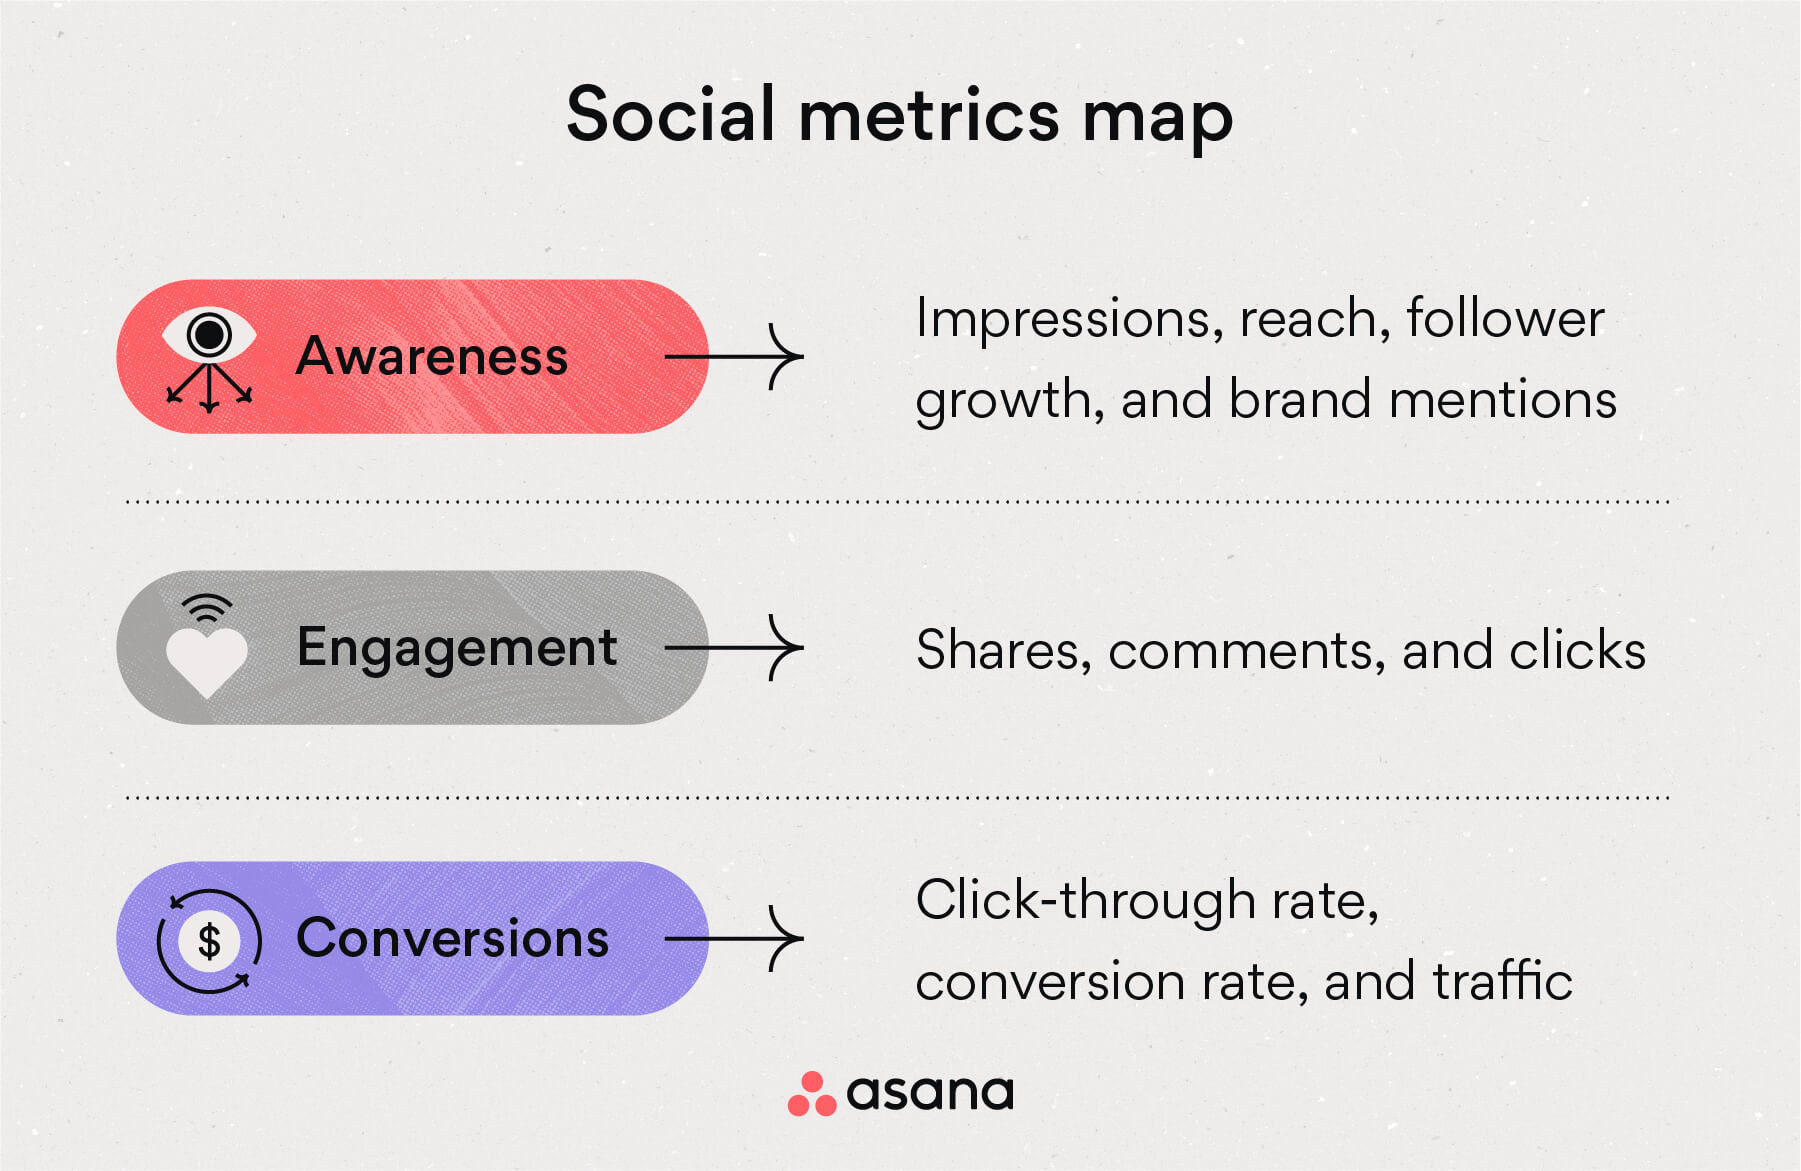
This structure directly relates to the marketing funnel you learned about in Module 1. Let's see how specific metrics align with each stage.
Social media analytics and reporting | Google Digital Marketing & E-commerce Certificate
Let's return to the Google video, which does an excellent job of connecting common metrics to the four stages of the marketing funnel: Awareness, Consideration, Conversion, and Loyalty.
Watch from 06:48 to 11:30. Pay attention to which metrics are important at each stage of the funnel (e.g., impressions for Awareness, applause rate for Consideration).
Here's a quick summary of how metrics align with the funnel stages:
- Awareness: Your goal is to capture attention. You'll focus on Reach and Impressions.
- Consideration: Your audience is thinking about your brand. You'll focus on Engagement Rate, shares, and comments.
- Conversion: You want the audience to take a specific action (like visiting your website or making a purchase). You'll track clicks and referrals.
- Loyalty: You want to turn customers into advocates. You'll look at things like positive customer testimonials or reviews.
By understanding this alignment, you can select the right "Key Performance Indicators" (KPIs)—the metrics that are most important for measuring the success of a specific campaign. If your goal is brand awareness, reach is a key KPI. If your goal is to build a community, engagement rate is a better KPI.
Conclusion
You now have a foundational understanding of the most important social media metrics and, crucially, what they represent. This knowledge is what elevates a social media user to a social media professional. It empowers you to measure your performance, demonstrate the impact of your work, and continuously optimize your strategy for better results.
Key Takeaways:
- Impressions are the total number of times your content was displayed.
- Reach is the number of unique people who saw your content.
- Engagement Rate is the percentage of your audience that actively interacted with your post, calculated by dividing total engagements by your number of followers.
- Metrics are not just numbers; they are indicators of your progress toward specific goals and should be aligned with the stages of the marketing funnel.
In our previous lessons, you've learned how to choose platforms, plan content, and now, measure success. The next logical step is to improve the content itself. In our next lesson, we will begin the Practical Social Media Content Creation module and focus on how to apply best practices for writing engaging social media captions and calls-to-action—skills that will directly help you boost your engagement rate