Hello! Welcome back to our course on the UK electrical grid.
In our last lesson, we explored the control room systems—SCADA and EMS—that the National Grid ESO uses to monitor and manage the grid. We learned that while SCADA provides essential data, it takes measurements only every few seconds. In a system where a major fault can unfold in a fraction of a second, operators need a much faster, more detailed view.
This lesson focuses on the technology that provides that high-definition picture. Our learning outcome is to explain how advanced grid monitoring technologies like Phasor Measurement Units (PMUs) improve real-time visibility of the network. We will discover what PMUs are, how they work, and why their data is transforming grid operation.
From Snapshots to a Live Video Feed
Think of a traditional SCADA system as taking a series of still photographs of the grid every few seconds. You can see what's happening, but you miss the smooth motion and subtle dynamics between the shots. PMUs, on the other hand, are like a high-speed video camera, capturing the grid's state dozens of times per second.
This "video feed" is made possible by measuring phasors. In an AC system, voltage and current are sine waves. A phasor is simply a way to represent that wave at a specific moment in time using its magnitude (the height of the wave) and its phase angle (its position along the wave cycle).

To build a strong intuition for these concepts, let's watch a short video that uses a great analogy.
This video from PJM Interconnection (a US grid operator) provides a clear, non-technical introduction to synchrophasors and what they measure.
Watch the first 1 minute and 20 seconds of the video. It introduces PMUs and explains magnitude, frequency, and phase angle using the analogy of ocean waves.
As the video explains, a PMU measures these key properties of the AC waveform. But its real power comes from two features that set it apart from older technology.
The Synchrophasor Advantage: Speed and Synchronisation
To understand what makes PMU technology so revolutionary, let's compare it directly with the traditional SCADA systems we discussed in the last lesson.
Synchrophasor Technology Improves Grid Visibility
This fact sheet from PJM details the advantages of synchrophasor technology over conventional monitoring.
Please read the first two sections, down to the heading 'Developing Advanced Monitoring and Modeling'. Focus on the comparison between PMU and SCADA data rates and the critical role of GPS time-stamping.
From that reading, two key advantages stand out:
- High Speed: PMUs record data around 30-50 times per second, whereas SCADA typically measures every 2 to 10 seconds. This high-resolution data stream can capture grid events that are too fast for SCADA to see.
- Synchronisation: This is the most crucial part. Every PMU has a GPS receiver to give each measurement a highly precise timestamp. This means data from a PMU in Scotland can be perfectly aligned and directly compared with data from a PMU in Cornwall at the exact same instant.
This synchronised, wide-area view allows operators to see how the entire system behaves dynamically, rather than just looking at isolated data points. This is why the measurements are often called synchrophasors.
How PMUs Improve Real-Time Visibility
Now that we know what PMUs measure and what makes their data special, let's explore how this translates into practical benefits for a grid operator. How does this high-speed, synchronised data actually improve their ability to see and understand the state of the network?
Let's return to the video to see what the different measurements tell an operator.
We'll now watch the rest of the 'Understanding Synchrophasors' video, which explains how operators interpret PMU data to monitor grid health.
Watch from 01:20 to the end. The video explains what changes in frequency, magnitude, and especially phase angle indicate about grid conditions like disturbances, oscillations, and stress.
The video gives us a great summary of the practical applications. Let's break down the key improvements to grid visibility:
-
Detecting Disturbances Instantly: If a large power station trips offline, the balance between generation and demand is broken, and the grid frequency will start to fall. PMUs detect this change instantly. Because the data is synchronised, operators can see where the frequency drop is most severe, immediately pinpointing the "epicentre" of the disturbance.
-
Seeing Dangerous Oscillations: Sometimes, parts of the power system can start to oscillate, with power swinging back and forth in an unstable way. These oscillations can be very fast and were difficult to detect with SCADA. PMUs make these dynamics clearly visible, allowing operators to take action before they lead to a wider blackout.
-
Measuring System Stress with Phase Angles: This is one of the most powerful applications. As the video explained, the difference in the phase angle between two locations on the grid is directly related to how much power is flowing between them. A larger angle difference means the transmission line is more heavily loaded and under more stress. Operators can watch these angles in real-time, giving them a direct indicator of stress across the network—much like a weather map showing areas of high pressure.
Test your understanding!
A large offshore wind farm in the North Sea suddenly disconnects from the grid due to a fault.
Based on what you've learned, how would a PMU-based monitoring system help the ESO operators understand and react to this event, in a way that would be superior to a traditional SCADA system?
Show answer
A SCADA system would eventually show the drop in power from the wind farm and a drop in grid frequency, but with a delay of several seconds.
A PMU system would provide a much richer and faster picture:
- Instantaneous Detection: All PMUs across the country would instantly detect the drop in grid frequency, confirming a large loss of generation.
- Locating the Source: The PMUs physically closest to the wind farm's connection point would show the most significant and fastest change in frequency and voltage, immediately telling operators where the problem originated.
- Assessing Impact: Operators could immediately see the phase angles across key transmission lines widening as power is rerouted from other generators to cover the shortfall, giving them a real-time view of how the stress is shifting across the network.
PMUs in the UK: Wide Area Monitoring Systems (WAMS)
Individual PMUs are the sensors. To make sense of their data, it must be collected and analysed in a central system. This is known as a Wide Area Monitoring System (WAMS).
The National Grid ESO is actively developing and trialling this technology to help manage the modern GB grid, with its increasing levels of renewable generation. This is not just a theoretical concept; it's a key part of the ESO's strategy.
Trial on Implementation of Wide Area Monitoring and Control System (WAMCS)
This project page from the National Grid ESO describes a recent trial to implement a Wide Area Monitoring and Control System (WAMCS) in the UK.
Read the 'Project summary', 'Benefits', and 'Outcomes' sections. Note why the ESO sees this technology as crucial for a grid with high renewable penetration and what the trial successfully demonstrated.
As you read, you'll have noticed the term WAMCS, which stands for Wide Area Monitoring and Control System. This is the next evolution, where the system not only provides visibility (monitoring) but can also be used to trigger automated, high-speed responses to grid events (control). The ESO's successful trial shows how this technology can be used to deliver vital services like frequency control much faster than traditional methods.
The overall process, from measurement to operator insight, can be visualized as follows:
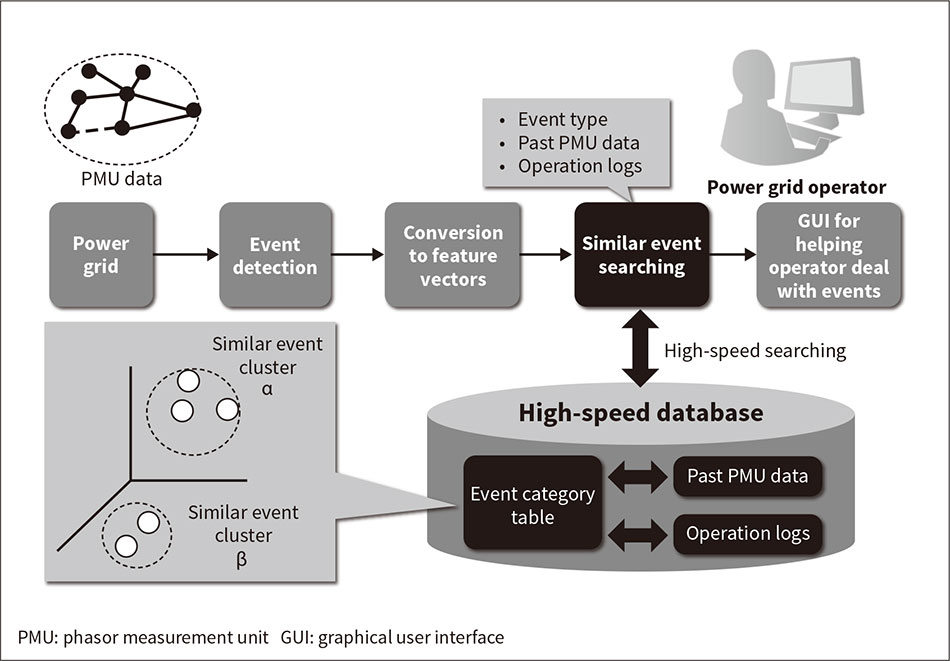
Conclusion
In this lesson, we've seen how Phasor Measurement Units are a significant leap forward from traditional grid monitoring. By providing high-speed, synchronised data, they give grid operators an unprecedented level of real-time visibility into the dynamic behaviour of the power system.
Key Takeaways:
- Phasor Measurement Units (PMUs) are high-speed sensors that measure the magnitude and phase angle of the AC waveform, timestamping each measurement with a precise GPS signal.
- Unlike slower SCADA systems, PMUs provide a synchronised, dynamic, "video-like" view of the entire grid, often called a Wide Area Monitoring System (WAMS).
- This enhanced visibility allows operators to:
- Instantly detect and locate disturbances like generator trips.
- Observe and mitigate potentially dangerous system oscillations.
- Directly monitor grid stress by observing phase angle differences.
- The National Grid ESO is actively implementing this technology to help manage the stability challenges of a grid with high levels of renewable generation.
In our previous lessons, we've focused on the technical systems and roles within the ESO. But the ESO doesn't operate in a vacuum. In our next lesson, we will explore the coordination challenges between the ESO, Transmission Owners (TOs), and Distribution Network Operators (DNOs), looking at how these different organisations must work together to keep the system running.