Hello! Welcome back to our course on the UK electrical grid.
In our last lesson, we met the "air traffic controller" of the grid: the National Grid Electricity System Operator (ESO). We learned that its primary job is to perform a constant balancing act, ensuring electricity generation matches demand second by second.
Now that we know what the ESO does, this lesson will dive into how and, crucially, when it does it. Balancing the national grid isn't a single action, but a continuous process that starts years in advance and intensifies right up to the moment you flip a switch.
Our goal is to map out this entire operational timeline. By the end of this lesson, you will be able to describe the operational timeline for grid balancing, from forecasting to real-time dispatch.
The Balancing Timeline: A Funnel of Increasing Certainty
Imagine trying to predict the exact amount of electricity Great Britain will need next Tuesday at 6:30 PM. You can make a good guess based on historical data, but the weather might change, a popular TV show might have its finale, or a large factory could plan unexpected overtime.
Now, imagine making that same prediction five minutes before 6:30 PM. Your forecast will be much more accurate.
This is the fundamental challenge the ESO and all market participants face. The operational timeline is designed like a funnel, allowing everyone to refine their plans as forecasts become more certain closer to "real-time."
The diagram below gives a fantastic overview of this entire process, showing the different stages and who is doing what. We will walk through each of these stages in this lesson.
Overview of market participant and system operator actions in Great Britain
This diagram, from a report by AFRY Management Consulting, shows the key stages of the balancing timeline. It separates the actions taken by market participants (like generators and suppliers) in the top half from the actions taken by the System Operator (ESO) in the bottom half. We'll explore this journey from left (days ahead) to right (real-time).
Phase 1: Market-Led Balancing (Years Ahead to 1 Hour Before)
For the vast majority of the timeline, the balancing act is led by the market itself. Generators, suppliers, and large businesses trade electricity with each other to ensure they can meet their commitments. This happens in a series of markets, each operating closer to the moment of delivery.
Electricity Markets in Great Britain - The Energy Academy (Series Three)
To understand these different market stages, let's watch some key segments from the 'Electricity Markets in Great Britain' video by Modo Energy. It breaks down the process very clearly.
Please watch the following three clips from the video: Introduction to the Timeline (03:04 - 03:56): This sets the scene, explaining that electricity is traded across massive timeframes. Forward Markets (10:53 - 13:20): Focus on the concept of 'reducing risk' by agreeing on prices for electricity to be delivered far in the future (months or years). Spot Markets (25:39 - 28:00): This is crucial. Pay attention to the difference between the Day-Ahead Market (trading for tomorrow) and the Intraday Market (trading for today) for fine-tuning positions.
Let's break down those market stages:
-
Forward and Futures Markets (Years to Months Ahead):
As the video explained, these are long-term contracts. A large supplier might agree to buy a certain amount of power from a wind farm operator for the whole of next winter. This isn't about precise balancing; it's about managing financial risk. The supplier gets a guaranteed price, and the generator gets a guaranteed buyer. This covers the predictable, "base load" demand. -
Day-Ahead Market (The Day Before):
By the day before delivery, the weather forecast is much clearer, and suppliers have a better idea of their customers' demand. They use the day-ahead market to "top up" what they need or sell any surplus they might have from their forward contracts. -
Intraday Market (The Day of Delivery):
Forecasts can still change on the day. An unexpected storm might increase wind generation, or a sudden cold snap might increase heating demand. The intraday market allows participants to make these final adjustments.
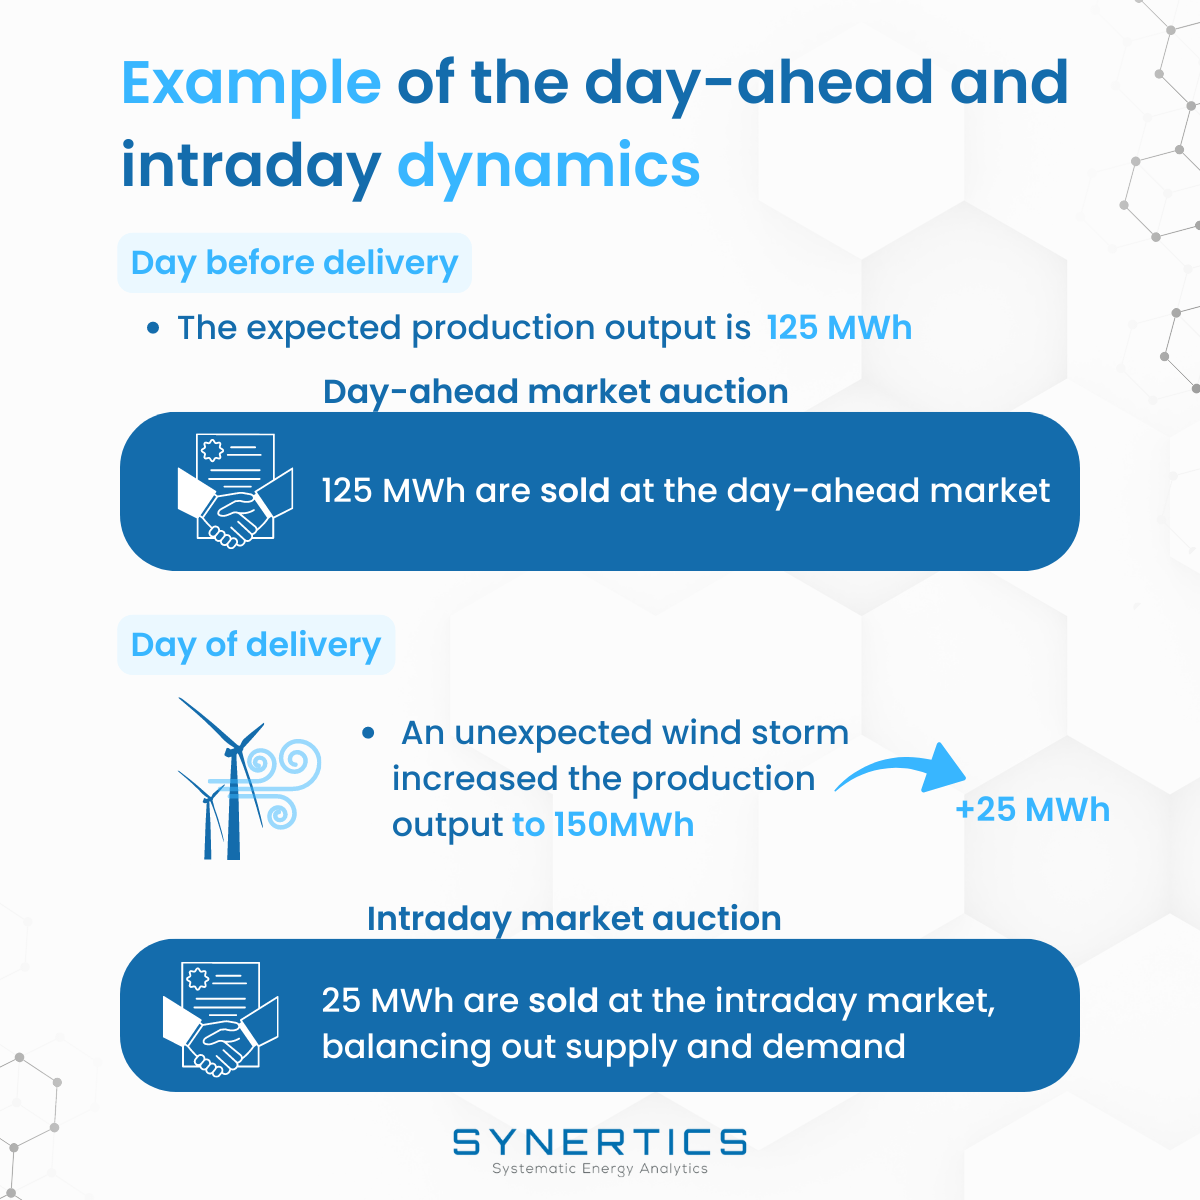
This whole sequence of markets is about decentralised, market-led balancing. Each participant is trying to balance their own "books" by matching the electricity they've contracted to buy or sell with what they will actually need or produce.
Phase 2: Gate Closure - The Handover
This leads to a critical moment in the timeline, where responsibility shifts from the market to the ESO.
Gate Closure happens one hour before each half-hour of electricity delivery. At this point, the intraday market closes. Every generator and supplier must submit their Final Physical Notification (FPN) to the ESO.
An FPN is a legally binding declaration of exactly how much electricity a generator intends to produce or a supplier expects to consume in that upcoming half-hour.
Electricity Markets in Great Britain - The Energy Academy (Series Three)
Let's return to the Modo Energy video to see a clear explanation of Gate Closure and Final Physical Notifications.
Please watch from 28:49 to 29:58. This clip explains what happens at gate closure and why the FPNs are so important for the ESO.
Think of gate closure as the moment all the individual players submit their final game plan to the coach (the ESO). The ESO now has a complete picture of the total planned generation versus the total expected demand across the entire country.
Phase 3: Real-Time Dispatch - The ESO Takes Control
Even with all the market trading and final notifications, the sum of all FPNs will never perfectly match the actual, real-time demand on the system. A power station might unexpectedly trip offline, or millions of people might turn their kettles on at once during the ad break of a popular show.
This final stage, from gate closure to the moment of delivery, is where the ESO takes direct control using its primary tool: the Balancing Mechanism (BM).
The BM is a special market that the ESO runs to make real-time adjustments.
- If the ESO sees that demand is about to be higher than generation, it will accept an "Offer" from a generator in the BM to increase its output for a certain price.
- If generation is about to exceed demand, it will accept a "Bid" from a generator to reduce its output for a price.
This allows the ESO to "balance" the grid second-by-second.
Electricity Markets in Great Britain - The Energy Academy (Series Three)
The final clip from the Modo Energy video explains how the Balancing Mechanism works in practice.
Please watch from 29:58 to 32:45. Focus on understanding how the ESO uses 'bids' and 'offers' from participants to make the final, crucial adjustments to balance the grid in real-time.
The Balancing Mechanism is the ultimate safety net, giving the ESO the control it needs to handle any unforeseen deviations and keep the frequency at a stable 50Hz.
Test your understanding!
Let's place some typical grid balancing activities on the correct point in the timeline. Match the activity to the most likely timeframe:
Timeframes:
A. Forward Market (Months/Years Ahead)
B. Day-Ahead / Intraday Markets (24 hours to 1 hour ahead)
C. Balancing Mechanism (The last hour)
Activities:
- A solar farm operator realises it's going to be sunnier than expected tomorrow and sells the extra expected generation.
- The ESO instructs a gas power station to increase its output immediately to compensate for a sudden drop in wind speed.
- An electricity supplier signs a contract with a nuclear power plant to buy a fixed amount of electricity every day for the next 3 years.
- A generator's FPN said it would produce 500MW, but the ESO accepts its 'bid' to reduce output to 480MW to help manage a surplus of power on the system.
Show answer
- B. Day-Ahead / Intraday Markets: The operator is refining their position based on a better weather forecast closer to real-time.
- C. Balancing Mechanism: This is a real-time, corrective instruction from the ESO to deal with an immediate imbalance.
- A. Forward Market: This is a long-term agreement designed to provide financial certainty for both parties, well in advance of delivery.
- C. Balancing Mechanism: The instruction from the ESO to deviate from the FPN happens in the final hour via the BM.
Conclusion
In this lesson, we've journeyed through the operational timeline for balancing the grid. We've seen how the process moves from long-term risk management to precise, real-time control.
Key Takeaways:
- Grid balancing is a multi-stage process that allows plans to be refined as forecasts become more accurate.
- Forward, Day-Ahead, and Intraday Markets are primarily used by participants to balance their own positions and manage financial risk. This is a market-led phase.
- Gate Closure, one hour before delivery, is the critical handover point where participants submit their Final Physical Notifications (FPNs).
- The Balancing Mechanism (BM) is the tool the ESO uses in the final hour to issue direct instructions (bids and offers) to participants, ensuring the system remains balanced in real-time. This is an ESO-led phase.
We've focused today on the timeline and the main markets. In our next lesson, we will zoom in on that critical real-time period. We'll explore the specific tools and "ancillary services," like frequency response, that the ESO uses within the Balancing Mechanism to handle sudden deviations and keep our power supply secure.