Welcome to the next lesson in our journey through core machine learning concepts. In our previous session, we established the critical practice of splitting data into training, validation, and test sets. This ensures we can tune our models iteratively without biasing our final performance assessment. Now that we have these distinct datasets, the natural next question is: what, exactly, should we measure to judge our model's performance?
This lesson answers that question by introducing the fundamental evaluation metrics for classification tasks. We will define and explore accuracy, precision, recall, and the F1-score. For you as an aspiring AI Engineer, these metrics are not just theoretical concepts; they are the vocabulary you will use daily to diagnose model behavior, communicate performance to stakeholders, and make crucial decisions about whether a model is ready for production.
The Foundation: The Confusion Matrix
Before we can calculate any metrics, we first need to organize a model's predictions in a way that clearly shows what it got right and what it got wrong. The standard tool for this is the confusion matrix. It's a simple table that compares the model's predicted classifications against the actual ground truth labels.
For a binary classification problem (e.g., "spam" vs. "not spam"), the matrix has four essential components.
A simple guide to building a confusion matrix
This article from the Oracle AI and Data Science Blog introduces the confusion matrix and its components. Please read the section "What is a confusion matrix?".
Focus on the definitions of the four quadrants: True Positive (TP), True Negative (TN), False Positive (FP), and False Negative (FN). Pay close attention to how the "positive" and "negative" classes are defined, which is crucial for correct interpretation.
To summarize these key terms:
- True Positive (TP): The model correctly predicted the positive class. (e.g., correctly identified a spam email as "spam").
- True Negative (TN): The model correctly predicted the negative class. (e.g., correctly identified a legitimate email as "not spam").
- False Positive (FP): The model incorrectly predicted the positive class. This is also known as a "Type I error." (e.g., incorrectly flagged a legitimate email as "spam").
- False Negative (FN): The model incorrectly predicted the negative class. This is also known as a "Type II error." (e.g., failed to detect a spam email, letting it into the inbox).
All the metrics we'll discuss today are derived from these four fundamental counts.
Accuracy: The Intuitive but Deceptive Metric
The most straightforward metric is accuracy. It simply measures the proportion of total predictions that the model got right.
This guide from Google's Machine Learning Crash Course provides a concise definition of accuracy and, more importantly, its limitations.
Read the section on Accuracy. Note the formula and pay special attention to the discussion on why accuracy can be a poor metric for imbalanced datasets.
As the article explains, if you have a dataset where 99% of examples are "not spam" and only 1% are "spam," a lazy model that always predicts "not spam" will achieve 99% accuracy. While technically accurate, this model is completely useless as it fails to identify any of the positive cases we care about. This is a common scenario in real-world applications like fraud detection, medical diagnosis, or system monitoring, where the "event of interest" is rare. This limitation is precisely why we need more nuanced metrics.
The video below gives an excellent intuitive explanation of this problem.
Precision, Recall, & F1 Score Intuitively Explained
This video from Scarlett's Log intuitively explains the core classification metrics.
Watch the section that defines accuracy and explains its major drawback, from the beginning of the accuracy section to the point where precision is introduced.
Precision and Recall: A Tale of Two Priorities
To overcome the shortcomings of accuracy, we turn to two complementary metrics: precision and recall. They allow us to focus on the performance of the positive class, which is often what we're most interested in.
The diagram below provides a great visual intuition for these two concepts.
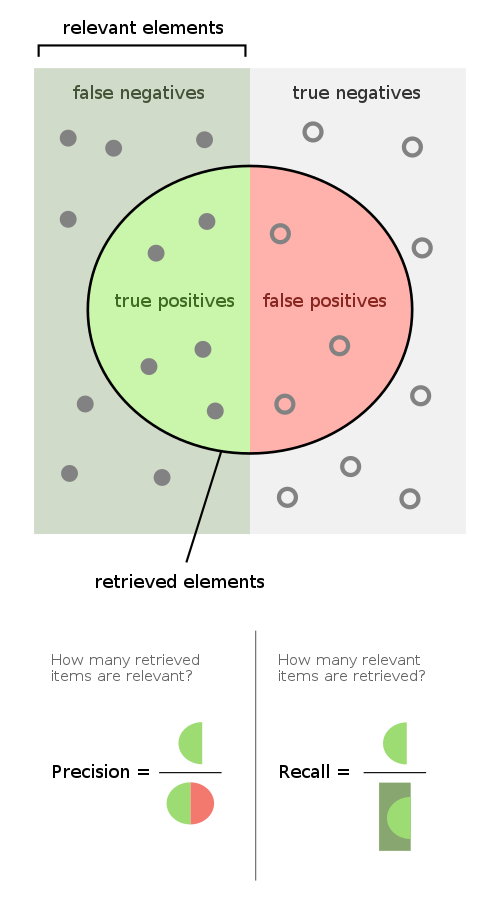
Precision: How a-ccurate are our positive predictions?
Precision answers the question: "Of all the instances the model predicted as positive, what fraction was actually correct?"
It's a measure of quality or exactness. High precision means that when the model says something is positive, it's very likely to be right. This minimizes False Positives.
Recall: How many actual positives did we find?
Recall, also known as sensitivity or the true positive rate, answers the question: "Of all the actual positive instances, what fraction did the model successfully identify?"
It's a measure of quantity or completeness. High recall means the model is good at finding all the positive instances, minimizing False Negatives.
Let's read the formal definitions and see how the trade-off between them works.
Continuing with the Google guide, we'll now look at the definitions of recall and precision.
Read the sections titled Recall, or true positive rate and Precision. Pay close attention to the formulas, \frac{TP}{TP+FN} for recall and \frac{TP}{TP+FP} for precision. Critically, understand the inverse relationship between them.
As you read, the core takeaway is that you can often tune a model to favor one metric over the other, but rarely can you maximize both simultaneously.
- Prioritize Precision when False Positives are costly: Think of a spam filter. A false positive means an important email lands in the spam folder and is missed. You want to be very precise when labeling something as spam.
- Prioritize Recall when False Negatives are costly: Think of medical screening for a serious disease. A false negative means a sick patient is told they are healthy, with potentially fatal consequences. You want to recall or "catch" every possible case, even if it means some healthy patients are flagged for further (low-cost) testing (i.e., you accept more false positives).
This image shows how these metrics are calculated from a confusion matrix.

F1-Score: The Balanced Metric
Since precision and recall are often in tension, how can we get a single score that summarizes model performance? A simple average is not ideal because it could hide poor performance in one of the metrics. Instead, we use the F1-score, which is the harmonic mean of precision and recall.
The key property of the harmonic mean is that it is pulled down by lower values more strongly than a simple average. A high F1-score requires both precision and recall to be high.
Let's look at the definition of the F1 score in the Google guide.
Read the section "(Optional, advanced) F1 score". Note the formula, \text{F1} = 2 \cdot \frac{\text{precision} \cdot \text{recall}}{\text{precision} + \text{recall}}, and the key insight that the F1-score will be closer to the lower value of the two.
The F1-score is an excellent default metric for many classification problems, especially when you have an imbalanced class distribution and you care about balancing the costs of false positives and false negatives.
Bringing It All Together in Practice
Now that we have the theory, let's see how these concepts are applied in a typical machine learning workflow. The following video walks through a simple example, calculates all the metrics we've discussed, and shows how to generate them using scikit-learn, a standard Python library you will encounter frequently.
Precision, Recall, F1 score, True Positive|Deep Learning Tutorial 19 (Tensorflow2.0, Keras & Python)
This video from the channel 'codebasics' provides a clear, step-by-step walkthrough of these concepts with a practical example and Python code.
Watch from the beginning to the end (full video). The video will cover: Defining TP, TN, FP, FN with a "dog vs. not-a-dog" example. Calculating Accuracy, Precision, and Recall step-by-step. Explaining the F1-score. Demonstrating how to generate a confusion_matrix and a classification_report in Python, which is how you will typically compute these metrics in your projects.
Conclusion
In this lesson, we have moved beyond simple accuracy to a more sophisticated and practical understanding of model evaluation for classification. Choosing the right metric is not just a technical detail; it's about aligning your model's performance with the goals of your application.
Key Takeaways:
- The Confusion Matrix (TP, TN, FP, FN) is the foundation for all classification metrics.
- Accuracy is the proportion of correct predictions but can be misleading on imbalanced datasets.
- Precision measures the quality of positive predictions (minimizing False Positives). Use it when the cost of a false positive is high.
- Recall measures the completeness of positive predictions (minimizing False Negatives). Use it when the cost of a false negative is high.
- The F1-Score is the harmonic mean of precision and recall, providing a single, balanced measure of performance, especially useful for imbalanced classes.
- The choice of metric is always context-dependent and should be driven by the specific problem you are solving.
We now have the tools to both partition our data for evaluation and measure performance on those partitions. In our next lesson, we will begin to look "under the hood" at how a model learns. We'll explore loss functions, which quantify a model's error, and gradient descent, the optimization algorithm that minimizes this error to improve the very metrics we've learned about today.