Hello! Welcome to the third lesson in our "Data Modeling Foundations for DAX" module.
In our last session, we distinguished between fact and dimension tables, identifying shipments as our central fact table and the others (products, people, locations, calendar) as our descriptive dimension tables. This was a crucial step in understanding the purpose of our data.
Today, we'll connect these pieces together. This lesson's goal is to create and configure one-to-many relationships between our tables in the Power BI Model View. By doing this, you will officially build the star schema for our "Awesome Chocolates" project. This is the structural foundation upon which all our future DAX calculations will be built.
The "Why" and "What" of Relationships
Before we start clicking and dragging in Power BI, it's vital to understand the theory, as you prefer. A relationship in a data model is a link that connects two tables based on a common column. This link allows Power BI to understand how data in one table filters data in another.
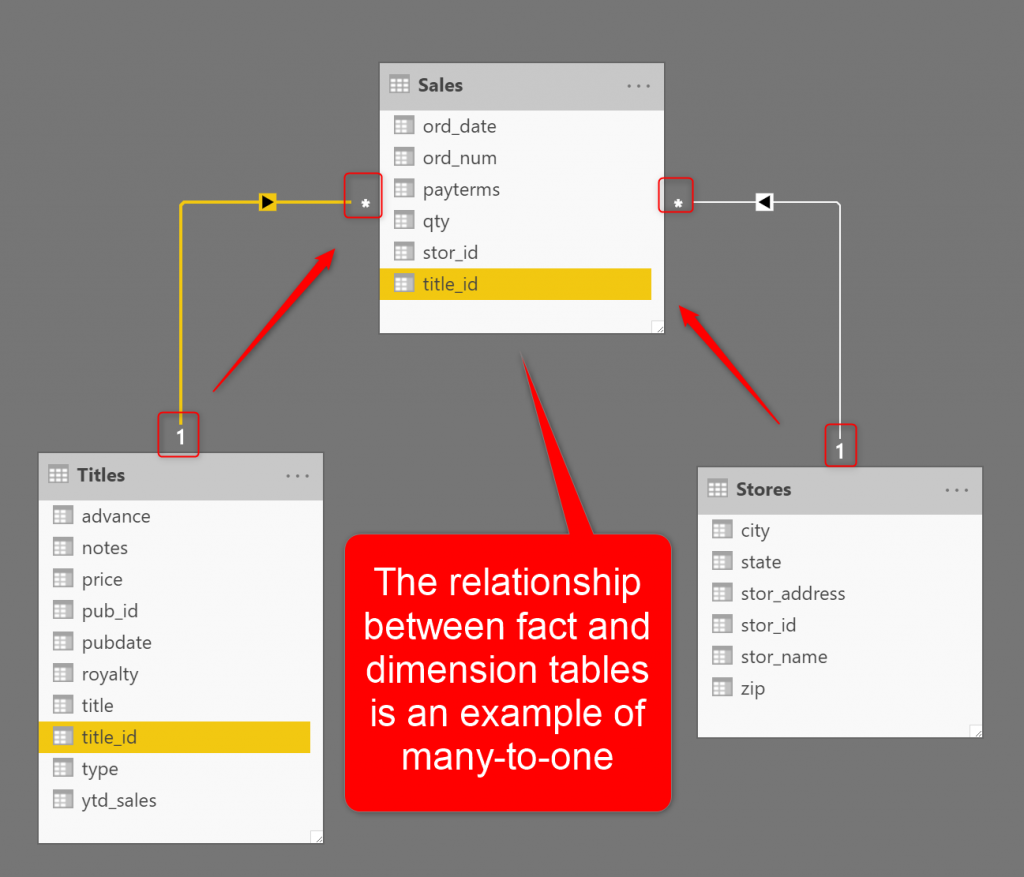
The most important property of a relationship is its cardinality, which defines how the records in the two tables correspond. For our star schema, the most common and important type is the one-to-many () relationship.
To understand this concept clearly, let's turn to a well-written article.
Many-to-One or Many-to-Many? The Cardinality of Power BI ...
The article 'Many-to-One or Many-to-Many?' from RADACAD provides an excellent, clear explanation of cardinality. We'll focus on the sections that define cardinality and the one-to-many relationship.
Please read the following sections: 'What is the Cardinality of the relationship?': This explains what the '1' and '*' symbols mean. 'One-to-Many, or Many-to-One' and 'Many-to-One Relationship between Fact and Dimension tables': These sections detail how this specific cardinality works and why it's the standard for connecting fact and dimension tables. Focus on how the uniqueness of values in a column determines whether it's on the 'one' side or the 'many' side of the relationship.
As the article explains, the logic is straightforward:
- The 'one' side is the table where the key column contains unique values. In our model, this is always the dimension table. For example, in the
productstable, eachPID(Product ID) appears only once. - The 'many' side is the table where the key column can have duplicate values. This is our fact table. For example, in the
shipmentstable, the samePIDcan appear many times because the same product can be part of many different shipments.
Therefore, the relationship between products and shipments is one-to-many. The same logic applies to all our other dimension tables connecting to the shipments table.
The "How": Creating Relationships in Power BI
Now that you understand the theory, let's put it into practice. We'll watch a video that walks through the process of connecting tables in Power BI's Model View.
Learn Data Modelling & Star Schema for Power BI in 20 minutes
The video 'Learn Data Modelling & Star Schema for Power BI in 20 minutes' by Chandoo provides a fantastic demonstration. It covers how Power BI sometimes automatically detects relationships and how to create them manually.
Please watch from 09:38 to 16:16. Pay close attention to: How to navigate to the Model View. The process of dragging a key column from one table to another to create a relationship. How to double-click a relationship line to open the 'Edit relationship' dialog and verify its properties (cardinality, selected columns).
Your Turn: Build the "Awesome Chocolates" Star Schema
It's time for you to build the model. Open your "Awesome Chocolates.pbix" file and follow these steps.
-
Navigate to the Model View: On the left-hand side of the Power BI window, click the icon that looks like three connected boxes. This is the Model View.
-
Arrange Your Tables: Drag the table boxes so that your
shipments(fact) table is in the center, and the four dimension tables (products,people,locations,calendar) are arranged around it. This visual layout reinforces the star schema concept. -
Create the Relationships: Power BI might have tried to create some relationships automatically. It's a good practice to review them and create any that are missing. We will create them manually to ensure you master the process. If any lines already exist, you can right-click and delete them for this exercise.
Create the four required relationships by dragging the key column from the dimension table (the 'one' side) and dropping it onto the corresponding key in the
shipmentstable (the 'many' side).- Drag
products[PID]ontoshipments[PID]. - Drag
people[SPID]ontoshipments[SPID]. - Drag
locations[GeoID]ontoshipments[GeoID]. - Drag
calendar[Date]ontoshipments[Ship Date].
- Drag
-
Verify Each Relationship: For each of the four lines you just created, double-click the line to open the Edit relationship window. Confirm the following for each one:
- The correct tables and columns are highlighted.
- The Cardinality is set to Many to one (*:1).
- The
shipmentstable is on the 'many' side (indicated by the*). - The dimension table is on the 'one' side (indicated by the
1). - The Cross filter direction is set to Single.
Your final model should look something like this, with the central fact table connected to all surrounding dimension tables.

Verification: The Impact of Relationships
Why was this process so important? Without these relationships, your tables are just isolated silos of data. Let's run a quick experiment to prove it.
- Go to the Report View (the top icon on the left pane).
- Add a Table visual to the canvas.
- From the Data pane, drag
products[Category]into the table visual. - Now, drag
shipments[Amount]into the same table visual.
If your relationships are correct, you will see a breakdown of the total sales Amount for each Category. The relationship allows the products table to filter the shipments table.
Now for the experiment:
- Go back to the Model View.
- Right-click the line connecting
productsandshipmentsand select Delete. - Return to the Report View.
What do you see? The Amount for every category is now the same large number—the grand total of all sales. Power BI no longer knows how to filter the sales amount for each specific category.
Please re-create the relationship between products and shipments before moving on! This simple test powerfully demonstrates that relationships are the engine that makes analysis across tables possible.
Conclusion
Congratulations! You have successfully built a functional star schema. This is a massive step in your journey as a data analyst. You've moved from having disconnected data to creating a structured, logical model ready for analysis.
Key Takeaways:
- Relationships connect tables in Power BI's Model View based on common key columns.
- Cardinality defines the relationship type; one-to-many () is the standard for connecting a dimension table ('one' side) to a fact table ('many' side).
- You can create relationships by dragging and dropping key columns between tables.
- Without correct relationships, filtering data across tables is impossible, leading to incorrect calculations and visuals.
Preview of the Next Lesson:
We've now imported our tables, defined their roles, and connected them. But why is this star schema structure so highly recommended? In the next and final lesson of this module, we will summarize why a well-structured star schema is essential for writing simple, powerful, and efficient DAX code. This will set the stage for Module 3, where you will write your first DAX measures.