Hello! Welcome back to our second module, "Data Modeling Foundations for DAX."
In our last lesson, you successfully imported the five tables for our "Awesome Chocolates" project into Power BI. We established that organizing data into multiple tables, rather than one single, large table, is a professional best practice that leads to smaller, faster, and more efficient models.
Today, we're going to build on that by defining the specific roles these tables play. You will learn to explain the difference between fact tables and dimension tables, which are the two fundamental components of the star schema we introduced. Understanding this distinction is one of the most important concepts in data modeling and is absolutely essential for writing correct and meaningful DAX.
The "What" vs. the "Who, Where, When"
At its core, the difference between a fact and a dimension table is simple:
- Fact tables record business events or transactions. They hold the numeric measurements and metrics you want to analyze. They answer questions like, "How much did we sell?" or "How many units were shipped?"
- Dimension tables provide the context for those events. They hold the descriptive details about the people, products, places, and times involved. They answer the questions, "Who made the sale?", "What was sold?", "Where was it shipped?", and "When did it happen?"
To see these definitions explained with clear examples, let's watch a short video.
Star Schema in 10 Minutes: The ONLY Explanation You Need!
The video 'Star Schema in 10 Minutes' from Pragmatic Works provides an excellent and concise explanation of fact and dimension tables.
Please watch from 00:54 to 03:00. Focus on how the video defines and provides examples for: The fact table as the center of the star, holding numerical data. The dimension tables as the descriptive entities that radiate outwards, giving context to the numbers.
Key Differences at a Glance
You've just seen the concepts explained visually. Now, let's solidify that understanding with a clear, written summary. The following article provides a direct comparison that is very useful to have as a reference.
Fact Table vs Dimension Table: Data Warehousing Explained
The article 'Fact Table vs Dimension Table' from Acceldata offers a fantastic, straightforward summary. We'll focus on the table that highlights the key differences.
Please read the section titled 'Key Differences Between Fact Table and Dimension Table.' Pay close attention to the summary table, as it's a perfect cheat sheet for distinguishing between the two.
To recap the most important distinctions from that table:
| Aspect | Fact Table | Dimension Table |
|---|---|---|
| Purpose | Stores numerical metrics (measures) | Provides descriptive context |
| Data Type | Numeric | Textual or categorical |
| Structure | Long and narrow (many rows of events) | Short and wide (descriptive attributes) |
| Query Focus | Used for aggregation and analysis | Used for filtering and grouping |
Applying the Concepts to Our Data Model
Now for the most important step: applying this theory to our project. In the last lesson, you imported five tables: shipments, products, people, locations, and calendar.
Based on the definitions, take a moment to look at the fields in each table within Power BI's Data View. Which table do you think is our fact table, and which are the dimensions?
Let's walk through the logic together:
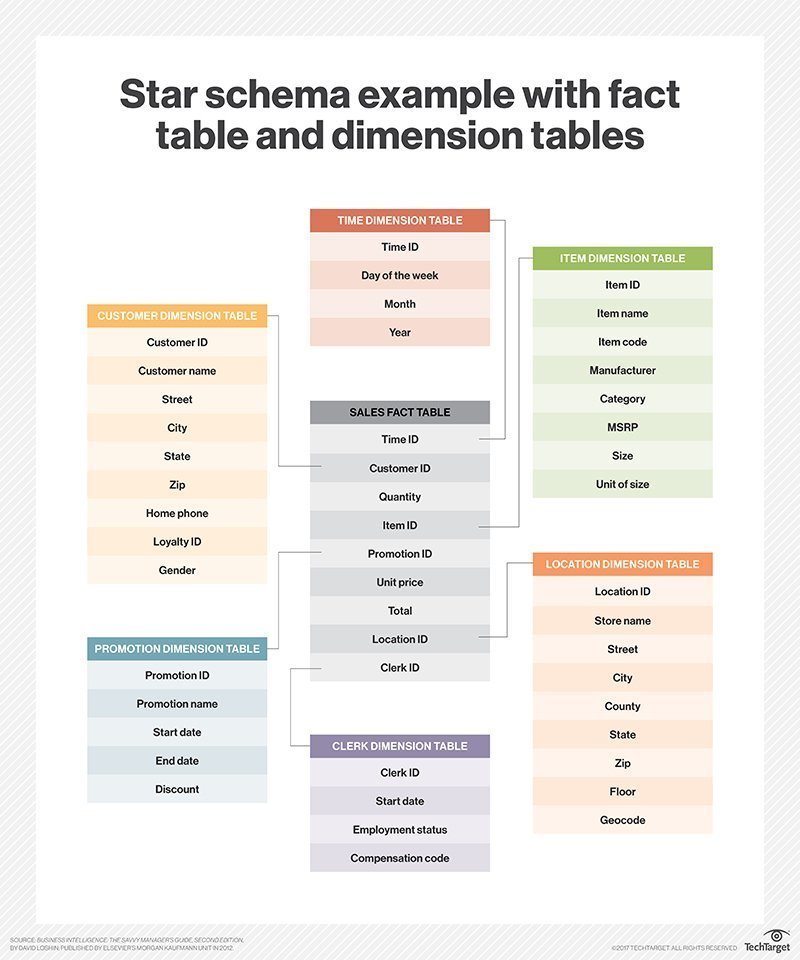
shipmentsTable: This table contains columns likeAmountandBoxes. These are the numerical values we want to sum, average, and analyze. Each row represents a single shipment event. It also contains ID columns (PID,SPID,GeoID) that link to other tables. Therefore,shipmentsis our fact table.productsTable: This table has columns likeProduct,Category, andSize. It describes the what that was sold. This is a dimension table.peopleTable: This table has columns likeSales PersonandTeam. It describes the who involved in the sale. This is a dimension table.locationsTable: This table has columns likeGeoandCountry. It describes the where the sale occurred. This is a dimension table.calendarTable: This table has columns likeYear,Month, andWeekday. It describes the when the sale happened. This is also a dimension table.
This arrangement forms a classic star schema, with the fact table at the center and the dimension tables radiating out like points of a star.
Why This Matters for You as an Analyst
Separating data into fact and dimension tables isn't just a theoretical exercise; it has huge practical benefits that make your job as an analyst easier and more effective.
Why Power BI loves a Star Schema
The video 'Why Power BI loves a Star Schema' from the popular Guy in a Cube channel clearly explains the practical benefits of this model structure.
Please watch the segment from 03:20 to 05:25. The presenter highlights two key advantages that directly impact your workflow: Usability: How the star schema makes the data model easier to understand and navigate for you and other report builders. Simpler DAX: A brief but powerful example of how this structure allows you to use simpler, built-in DAX functions instead of writing complex custom code.
As the video shows, a well-structured star schema isn't just about performance—it provides a more intuitive and logical framework for your analysis. When you want to filter sales by a product category, you instinctively know to use the products table. When you need to calculate total sales, you know the data resides in the shipments table. This clarity is the foundation for everything we will do in DAX.
Conclusion
Excellent work. You've now grasped the fundamental theory behind the data model we're building. This is a critical milestone that moves you from simply loading data to truly understanding its structure and purpose.
Key Takeaways:
- Fact tables store the quantitative measures of your business (e.g., Sales Amount, Quantity).
- Dimension tables store the descriptive context used for filtering and grouping (e.g., Product Name, Customer City, Date).
- In our project,
shipmentsis the fact table, whileproducts,people,locations, andcalendarare our dimension tables. - This separation into a star schema improves usability, simplifies DAX, and enhances performance.
Preview of the Next Lesson:
We've loaded our tables and defined their roles. The next logical step is to tell Power BI how they are connected. In the next lesson, you will learn how to create and configure the one-to-many relationships between our fact and dimension tables, officially building the star schema in the Power BI Model View.