Hello! Welcome to the second module of our course, "Data Modeling Foundations for DAX."
In the last module, we focused on the crucial first step of the data analyst workflow: defining the business problem. We established a clear problem statement for our stakeholder at AtliQ Hardware, giving us a "north star" for our entire project.
Now, we move to the next phase: gathering and preparing our data. This module is all about building the foundation upon which all our DAX calculations will rest. A well-structured data model is the secret to writing simple, efficient, and correct DAX.
In this first lesson, we will perform the initial, practical step of importing our data into Power BI. You will learn how to bring in multiple related tables, which form the building blocks of a professional data model.
Why Not Just One Big Table?
Before we start importing, let's address a fundamental question. Given your experience with logistics and supply chains, you've likely worked with large spreadsheets or data exports. A common impulse is to try and consolidate everything into one massive table. However, for data analysis in Power BI, this is almost always the wrong approach.
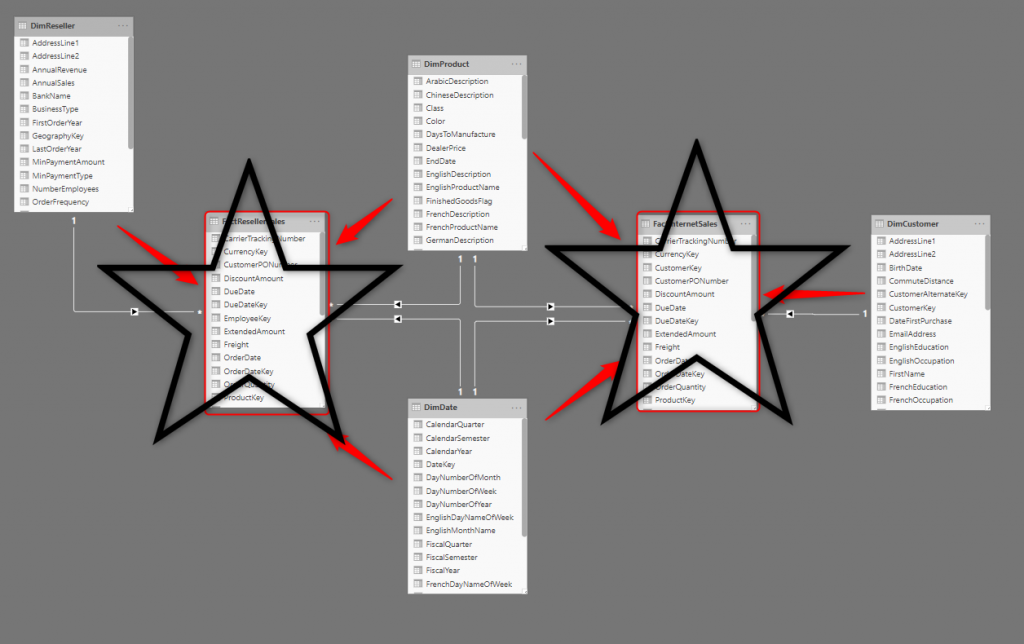
The best practice is to organize data into a star schema, which involves a central "fact" table surrounded by several "dimension" tables. We'll explore these terms in detail in the next lesson, but for now, think of it as keeping information about different business entities (like Products, Customers, Dates) in separate, tidy tables.
This approach has significant benefits for model size, performance, and the simplicity of your future DAX formulas.
To understand the core concepts, let's watch a short introductory video.
Learn Data Modelling & Star Schema for Power BI in 20 minutes
The video 'Learn Data Modelling & Star Schema for Power BI in 20 minutes' by Chandoo provides a great high-level introduction to these concepts using a clear, practical example.
Please watch from the beginning until 03:59. Focus on these key ideas: Why data modeling is a crucial step in Power BI. The concept of breaking data into multiple tables. The distinction between a 'fact' table (what happened) and 'dimension' tables (the who, what, where, when).
The Analyst's Task: Importing the Data
Now that you have a conceptual understanding, let's get hands-on. Our task is to import the data for our analysis project. For the rest of this course, we'll use the "Awesome Chocolates" dataset introduced in the video you just watched. It's a clean, well-structured example that's perfect for learning DAX.
The following video segment will walk you through the exact steps to get this data into Power BI. I recommend you follow along on your own computer.
Learn Data Modelling & Star Schema for Power BI in 20 minutes
Let's continue with the Chandoo video. This section demonstrates the practical steps of importing the multiple tables from the provided Excel file into Power BI.
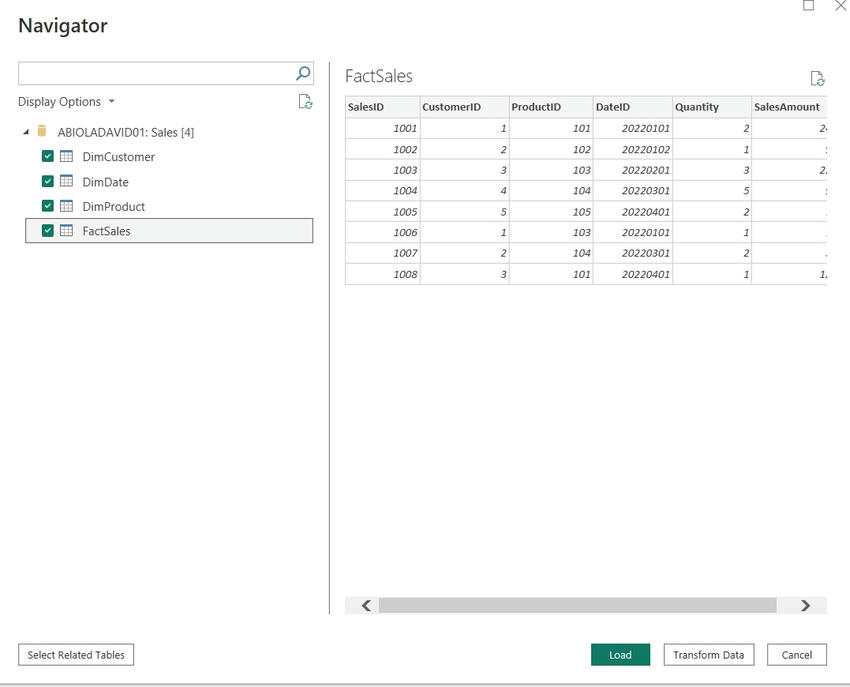
Watch from 09:38 to 11:32. The video description on YouTube contains a link to download the Excel file. Please download it and follow along with these steps: In Power BI, use Get Data > Excel Workbook to select the file. In the Navigator window, select the five tables (not the sheets with the _data suffix). Click Load.
After loading, you should see the five tables (shipments, products, people, locations, calendar) appear in the Data pane on the right side of your Power BI window.
First Look: The Power BI Views
With the data loaded, let's take a quick tour of where to see it. Power BI has three main views, accessible via the icons on the left-hand side:
- Report View: The default view, where you build visuals.
- Data View: Here, you can inspect the data inside each table, much like in an Excel spreadsheet.
- Model View: This is where you see your tables and the relationships between them. It's the architectural blueprint of your data model.
Take a moment to click on the Data View and select each of the tables you imported to familiarize yourself with their contents.
Now, click on the Model View. You'll see that Power BI has already attempted to create relationships between the tables. Don't worry if it doesn't look perfect yet; we'll learn how to manage these relationships in the next lesson.
Proof of Concept: Why the Star Schema Wins
You've successfully imported the data using a multi-table structure. But why was this worth the effort? To solidify your understanding, let's explore a powerful demonstration that compares the performance of a star schema ("slim model") against a single denormalized table ("fat model").
The following resource from SQLBI, a leading authority on DAX, uses a massive 4-billion-row dataset to prove the point. While the content is advanced, we'll focus only on the high-level conclusions.
Star schema or single table in Power BI
The article 'Star schema or single table in Power BI' by SQLBI provides definitive proof of the star schema's superiority. We will focus on two key outcomes: model size and slicer performance.
This video is dense, but we only need the key takeaways. Please watch these specific segments: Model Size Comparison (03:12 - 05:20): Pay attention to the dramatic difference in file size between the 'slim' (star schema) and 'fat' (single table) models. The narrator explains that denormalizing columns (copying them into the main table) drastically reduces compression efficiency. Slicer Performance (28:12 - 32:19): This is the most critical part. Observe the staggering difference in speed when populating a simple slicer visual. The star schema is instantaneous, while the single-table model takes many seconds. This is because the star schema reads from a small dimension table, while the fat model must scan the entire multi-billion-row fact table. Conclusion (32:19 - 35:47): Listen to the final summary, which reinforces that the star schema almost always wins in real-world scenarios.
The key insight is that while a single large table might feel simpler, it results in a larger, slower, and less efficient model. By keeping our tables separate, we empower the Power BI engine to work in the most optimal way.
Conclusion
Well done! You've taken the first and most fundamental technical step in our project. You've successfully imported multiple related tables into Power BI and, just as importantly, you understand why this multi-table approach is a professional best practice.
Key Takeaways:
- Data for analysis in Power BI should be organized into multiple related tables.
- The Navigator window is used to select and load tables from a data source.
- The Model View provides a visual representation of your data tables and their relationships.
- A multi-table star schema leads to a smaller model size and significantly better performance, especially for user-facing interactions like slicers, compared to a single large table.
Preview of the Next Lesson:
Now that our tables are loaded, we need to understand their roles and formalize their structure. In the next lesson, we will dive into the core of the star schema: you will explain the difference between fact tables and dimension tables and learn why this distinction is the key to unlocking powerful analysis with DAX.