Hello! Welcome to the final lesson in our module on "Data Modeling Foundations for DAX."
In our last three lessons, we've been hands-on: we imported our data, distinguished between fact and dimension tables, and connected them to build a complete star schema in Power BI's Model View. You've successfully built the "what."
Today, we address the all-important "why." The learning outcome for this lesson is to explain why a well-structured star schema is essential for writing effective DAX. Understanding this is what separates a beginner who just follows steps from a professional analyst who builds robust, scalable, and accurate reports. This lesson is the critical bridge between data modeling and the world of DAX calculations we're about to enter.
We will explore four key benefits of using a star schema:
- Accuracy: Ensuring your calculations are correct and reliable.
- Simplicity: Making your DAX formulas easier to write and understand.
- Performance: Making your reports faster and more responsive.
- Usability: Making your data model intuitive for you and others to use.
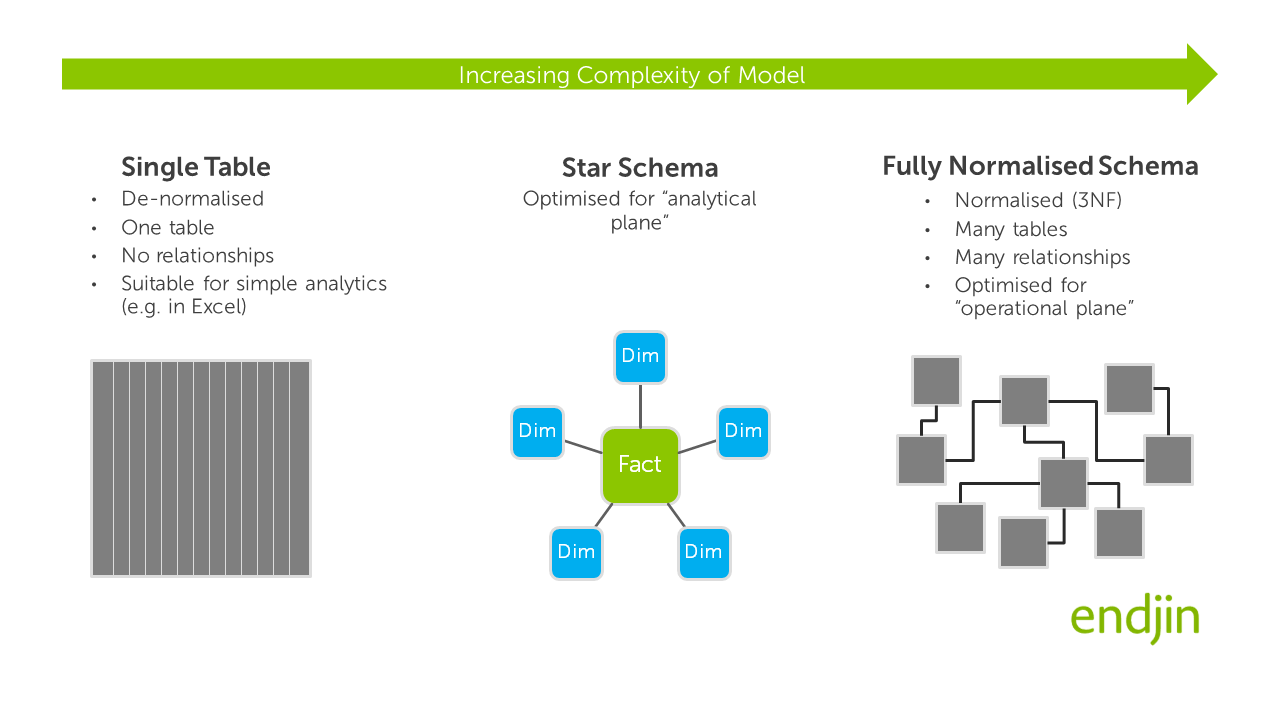
The Problem with "Flat" Data
Before we praise the star schema, let's understand the alternative. Many people start by loading a single, large, "flat" table into Power BI, containing all their columns in one place. It seems simple at first, but it creates significant problems that we'll explore.
1. Accuracy: The Foundation of Trust
The most critical reason for using a star schema is that it helps ensure your calculations are correct. A poorly structured model can produce numbers that look plausible but are fundamentally wrong.
To understand how this happens, we'll examine how Power BI uses the relationships you built to filter data. This process is called filter propagation.
Learn Data Modelling & Star Schema for Power BI in 20 minutes
The video 'Learn Data Modelling & Star Schema for Power BI in 20 minutes' by Chandoo provides an excellent visual explanation of filter propagation.
Please watch from 16:21 to 20:30. In this section, the presenter builds a simple chart and then explains exactly what happens 'behind the scenes' when a user clicks a slicer. Focus on: How the filter flows from the dimension table (e.g., locations) to the fact table (shipments). What happens to the visual when the relationship is deleted. This is a powerful demonstration of why the structure is essential for the visual to get the correct numbers.
As the video demonstrates, the relationships act as pathways for filters. When you slice by "New Zealand," the model filters the locations dimension table to just that one row. The relationship then tells Power BI to only consider the rows in the shipments fact table that correspond to New Zealand. Without this relationship, the slicer does nothing, and the DAX engine calculates the total for all countries, giving a misleading result.
Now, let's dig into a more subtle but equally dangerous issue. What happens when there's no data for a particular combination? This is where a flat table can fail catastrophically.
The importance of star schemas in Power BI - SQLBI
The article 'The importance of star schemas in Power BI' from the experts at SQLBI provides a brilliant, though more advanced, explanation of why a star schema ensures accurate results even when data is missing.
Please read the following sections: Start by reading the initial scenario under the heading that begins 'The data model to analyze is simple'. Understand the business question about comparing a salon to its group. Skim through the DAX formulas and note how the report based on a single table is 'clearly wrong'. Read the section that begins 'Therefore, we can expand the full expression...'. The key insight here is that when you ask for the 'Group' from the fact table (Visits), and there are no visits for a certain combination, the DAX engine has no way to know what the group is, so it returns a blank. Finally, read the solution under 'Once the dimension is in place...'. Notice how using a dedicated Beauty Salon dimension table solves the problem because the relationship between a salon and its group is stored independently of the visits. Don't worry about mastering the DAX code itself; focus on the logic of why relying on the fact table for attribute information is risky.
The key takeaway from SQLBI is profound: Dimension tables describe your business entities, while fact tables record what happened. A star schema keeps these separate. The Beauty Salon dimension knows that "Nails & C" is in the "Nails" group, regardless of whether it had any male web developer customers. A flat table only knows about combinations that exist in the transaction history, leading to inaccurate analysis.
2. Simplicity: Writing Cleaner, More Powerful DAX
A well-structured star schema makes your DAX formulas dramatically simpler, more readable, and easier to maintain. This is especially true for time intelligence calculations, which are central to your goal of mastering YoY and MoM analysis.
Let's see a direct comparison.
Why Power BI loves a Star Schema
The video 'Why Power BI loves a Star Schema' from Guy in a Cube clearly demonstrates how a star schema simplifies DAX.
Please watch from 03:52 to 05:05. The video contrasts the DAX required to calculate 'Sales Year-to-Date' in a flat file versus a star schema model. Notice the difference in complexity and readability.
The difference is clear:
- Flat File: You have to manually write complex filtering logic to define what "year-to-date" means.
- Star Schema: You use a simple, built-in function like
TOTALYTD. This is possible only because you have a dedicated, properly configured Calendar dimension.
This principle is beautifully summarized in the article "Beyond the Flat Table". The author notes that after building a proper star schema, "...it’s the first time in a while that writing DAX didn’t feel like fighting the table." By doing the modeling work upfront, the subsequent DAX becomes about adding value, not fixing structural problems.
3. Performance: Faster Reports and Refreshes
Your experience as an analyst and the experience of your end-users depend on report performance. A star schema is architected to work efficiently with Power BI's internal data engine (the VertiPaq engine).
Let's return to the Guy in a Cube video to see the impact.
Why Power BI loves a Star Schema
We'll now look at the performance benefits discussed in the same video.
Please watch from 05:05 to 07:22. This section covers two aspects of performance: Query Performance: How quickly visuals render on the screen. Note the difference in query time (milliseconds) between the flat file and the star schema. Refresh Performance: How quickly Power BI can load the data. The difference here is dramatic (minutes vs. hours).
The performance gains come from a few factors:
- Dimension tables are small and have low cardinality (fewer unique values), which the Power BI engine can scan and cache very quickly.
- Fact tables become "narrower" because the repetitive descriptive text is stored in the dimensions. This reduces the overall size of the data model in memory.
- The engine is highly optimized for filtering small dimension tables and then applying those filters to the large fact table.
4. Usability: An Organized, Intuitive Model
Finally, a star schema is simply easier for humans to understand. When you go to the Fields pane in Power BI, you aren't faced with a single, overwhelming list of 100 columns. Instead, you see a clean, organized set of tables that represent your business concepts.

In a professional environment, you are often building models that other analysts will use. Hiding the key columns used for relationships and organizing fields into logical tables (as we will practice later) turns your data model into a self-documenting, user-friendly tool.
Conclusion
You have now completed the foundational module on data modeling. You not only know how to build a star schema but, more importantly, why it is the professional standard for analytics in Power BI.
Key Takeaways:
- Accuracy: A star schema ensures correct calculations by separating descriptive attributes (dimensions) from transactions (facts), allowing filters to propagate reliably.
- Simplicity: It simplifies DAX formulas, enabling you to use powerful built-in functions for complex calculations like time intelligence.
- Performance: It leads to faster reports and more efficient data refreshes because it's optimized for the Power BI engine.
- Usability: It creates a clean, organized, and intuitive data model that is easy for analysts to understand and use.
Preview of the Next Lesson:
With our robust and reliable data model in place, we are finally ready to start writing DAX code. In our next lesson, we will begin Module 3 by tackling the most fundamental concept in DAX: the difference between calculated columns and measures, and when you should use each.