Hello! Welcome to Module 3, "DAX Fundamentals." In the previous module, we laid the critical groundwork for our entire analysis by building a well-structured star schema. You learned that this model isn't just a technical exercise; it's the key to ensuring accuracy, simplifying your formulas, and boosting report performance.
Now, with our solid data model in place, we can confidently step into the world of DAX. This lesson tackles the most fundamental concept you'll need to master: the difference between calculated columns and measures.
Your learning outcome for this lesson is to explain the difference between calculated columns and measures, and when to use each. Understanding this distinction is non-negotiable for any aspiring data analyst. Choosing the wrong one can lead to incorrect results, slow reports, and an inflexible data model. By the end of this lesson, you'll have a clear framework for making the right choice every time.
The Two Pillars of DAX Calculations
At first glance, calculated columns and measures seem similar—they both use DAX formulas to create new values. However, they are fundamentally different in how they are computed, how they are stored, and how they interact with your report.
To start, let's get a high-level overview from the experts at SQLBI. This video clearly explains the core differences.
Measures vs. calculated columns in DAX and Power BI
This video from the SQLBI YouTube channel clearly explains the fundamental differences in how calculated columns and measures work.
Watch from 00:38 to 02:26. Pay close attention to the three key differences discussed: When they are computed (at data refresh vs. at query time). How they are stored (using model space vs. just storing the formula). What context they operate in (row context vs. filter context).
Let's break down those concepts further.
1. Calculated Columns: Stored, Row-by-Row Values
A calculated column is a new column that you physically add to one of your tables. The DAX formula for a calculated column is evaluated for each row in the table during data refresh, and the results are stored in your data model.
- Calculation Context: It operates in a Row Context. This means that when the calculation is performed for a specific row, it can only see the values in other columns of that same row.
- Storage: The results are materialized and stored in your Power BI file, which consumes memory (RAM) and increases the file size.
- Recalculation: The values are only recalculated when the data model is refreshed.
A great analogy is adding a new formula column in an Excel spreadsheet. You write the formula once, it calculates a value for every single row, and those values are saved within the file.
Let's see this in action.
Measures Versus Calculated Columns in DAX and Power BI - All You Need to Know
This video from Miss Microsoft on YouTube provides a very clear, step-by-step demonstration of how to create calculated columns and how they behave.
Watch from the beginning up to 05:47. As you watch, focus on: The concept of row context—the calculations are done row-by-row. How the RELATED function is used to pull data from a related dimension table (the Product List table) into the fact table (Sales Data). This is a direct benefit of the star schema you built! Notice that as each column is created, the values appear immediately in the data table view.
2. Measures: Dynamic, On-the-Fly Aggregations
A measure is a formula for a calculation that is evaluated on demand, whenever you add it to a visual in your report.
- Calculation Context: It operates in a Filter Context. This means the calculation is performed on an aggregation of data based on the filters currently active in the report (e.g., from slicers, chart axes, or other visuals).
- Storage: Only the DAX formula itself is stored in the model. The results are not stored, so measures have a negligible impact on file size.
- Recalculation: The value is recalculated every time the user interacts with the report, ensuring the result is always dynamic and responsive to the current view.
The analogy here is a formula in an Excel PivotTable. The value in a PivotTable cell isn't stored anywhere; it's calculated on-the-fly based on the rows, columns, and filters you've applied.
Now, let's contrast this with the calculated column you just saw.
Measures Versus Calculated Columns in DAX and Power BI - All You Need to Know
The same video continues by creating a similar 'Sales Value' calculation, but this time as a measure. This highlights the crucial differences in DAX syntax and behavior.
Please watch from 05:47 to 14:09. This is a critical section. Pay attention to: Why simply typing Quantity * Price does not work in a measure (it lacks row context). The introduction of an iterator function (SUMX) to first perform the row-by-row calculation and then aggregate the result. How the measure's value is not stored but is calculated 'on the fly' when you add it to a visual. This is filter context in action.
When to Use Each: The Decision Framework
Now for the most important part: applying this knowledge. You understand the "what" and "how," so let's focus on the "when." Your choice depends entirely on what you want to achieve.
Calculated Columns and Measures in DAX
The following article by SQLBI provides definitive guidelines for choosing between calculated columns and measures. This is the core knowledge for this lesson.
Please read the section titled 'Choosing between calculated columns and measures'. Focus on the bulleted lists that start with 'You have to define a calculated column whenever...' and 'you must define a measure whenever...'. These are your key decision-making rules.
To summarize and simplify those rules:
You MUST use a CALCULATED COLUMN when you want to:
- Slice or Filter: Place the result in a slicer, or use it on the axis of a chart (e.g., grouping sales by a price bracket). You can only slice or group by a physical column.
- Categorize: Create a static label for each row, like flagging a transaction as "High Profit" or "Low Profit".
- Perform a strictly row-level calculation: When the logic must be evaluated for each row independently, such as
Sales[Price] * Sales[Quantity]. While you can do this with a measure usingSUMX, creating a column is sometimes simpler if the value is used repeatedly.
You SHOULD use a MEASURE when you want to:
- Calculate an aggregate value: Compute a summary like total sales, average cost, or number of customers. This is the most common use case for measures.
- Calculate ratios and percentages: Any calculation that depends on an aggregated total, such as "Profit Margin" (
Total Profit / Total Revenue) or "% of Grand Total". Trying to do this in a calculated column will produce incorrect results at the total level. - Keep your model lean and efficient: Since measures don't use RAM, using them whenever possible is a best practice for performance.
Summary and Quick Reference
This is a concept that becomes clearer with practice, but having a solid reference is invaluable.
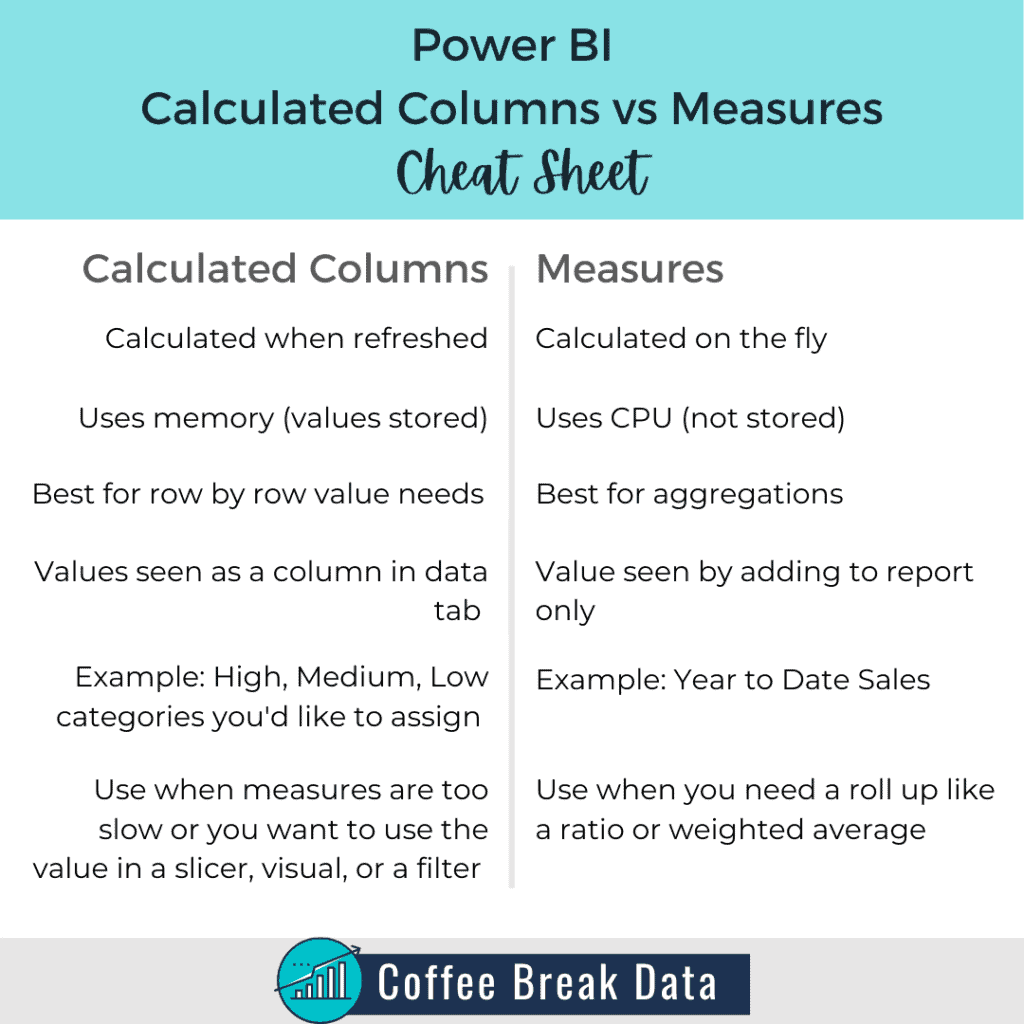
Conclusion
You have now learned the fundamental difference between the two main types of calculations in DAX. This knowledge is the bedrock upon which all your future DAX skills will be built.
Key Takeaways:
- Calculated Columns are computed row-by-row at data refresh, stored in the model, consume memory, and are best used for slicing or creating static row-level categories. They operate in a row context.
- Measures are computed on-the-fly based on user interactions, are not stored, have minimal memory impact, and are best for dynamic aggregations, ratios, and KPIs. They operate in a filter context.
- The Golden Rule: If you want to see the result in a slicer or on a chart axis, use a calculated column. For almost everything else, especially summarizing numbers, a measure is the right choice.
Preview of the Next Lesson:
Theory is great, but practice is better. In our next lesson, you will get your hands dirty and write your first DAX formulas. We will start by creating a practical calculated column to enhance our data model, and then we will write several essential measures using basic aggregation functions like SUM, AVERAGE, COUNT, and DISTINCTCOUNT.