Hello! Welcome back to our journey into mastering DAX.
In our last few lessons, we've been busy creating foundational measures like Total Revenue, Total Profit, and Profit Margin. While these measures work correctly, as you build more complex reports, simply getting the right number isn't enough. Professional data analysts ensure their work is clean, readable, and easy for others (and their future selves!) to understand.
This lesson focuses on that professionalism. Your goal is to apply proper naming conventions and formatting to DAX measures for readability. We'll cover three key areas: how you name your measures, how you organize them in your data model, and how you format the DAX code itself. Adopting these habits now will pay huge dividends as your formulas become more complex.
Why Do Naming and Formatting Matter?
Imagine opening a report you built six months ago or, even worse, inheriting a report from a colleague who just left. If the measures are named cryptically (e.g., Calc1, SlsAmt), and the formulas are a single, unformatted line of code stretching across the screen, your first few hours will be spent just trying to figure out what's going on.
Good conventions and formatting are about:
- Readability: Making your logic easy to follow.
- Maintainability: Making it simple to debug and update measures in the future.
- Collaboration: Allowing teammates to understand and contribute to your work.
- Professionalism: Demonstrating that you build high-quality, thoughtful reports.
Part 1: Naming Conventions - Speaking the Language of Business
The most important rule for naming is to use terms that your business users understand. Your background in management will give you a great advantage here—you're used to thinking in terms of business outcomes, not technical jargon.
Let's start with some expert advice on this.
Best Practices for Power BI modelling
The video 'Best Practices for Power BI modelling' by Curbal emphasizes the importance of using business-friendly names.
Please watch the following two clips: From 03:01 to 04:18: Focus on the core message about renaming technical fields to match business terminology. From 05:35 to 07:45: Pay attention to the specific recommendations on what to avoid, such as all caps, camel casing, and unnecessary acronyms.
To build on this, let's look at the industry-standard guidelines from SQLBI, a leading authority on DAX.
DAX Naming Conventions - SQLBI Docs
The 'DAX Naming Conventions' guide from SQLBI provides a clear and structured set of rules. We'll focus on the rules for measures.
Please read the section titled 'Measures'. Notice the recommendations for using spaces, common acronyms, and specific suffixes for time intelligence calculations (like YTD, PY).
Summary of Naming Best Practices for Measures:
- Be Clear and Descriptive:
Total Revenueis better thanTotRev. - Use Spaces:
Profit Marginis more readable for users thanProfitMargin. - Avoid Technical Prefixes/Suffixes: Don't name a measure
Measure_Sales. Its icon in Power BI already tells you it's a measure. - Use Common Acronyms Wisely:
YoY Growthis acceptable if everyone in the business understandsYoYmeans "Year-over-Year." - Use Standard Suffixes: For time intelligence measures (which we'll build later), use suffixes like
YTDfor Year-to-Date orPYfor Prior Year (e.g.,Total Revenue YTD).
Part 2: Organizing Your Measures
As you create more measures, the Fields pane in Power BI can become cluttered, making it hard to find what you need. The solution is to organize them.

There are two main techniques for this: Measure Tables and Display Folders.
Data Model Guidelines and Best Practice
The Zebra BI Knowledge Base provides excellent, practical steps for organizing measures. This article will walk you through creating dedicated tables and folders for your measures.
Please read two sections from this article: Start with 'Create Measure Tables'. Follow the steps to understand how to create a special table that will only hold measures. Then, read 'Organize measures in folders'. This shows you how to create sub-folders for even more detailed organization.
- Measure Tables: A measure table is a dedicated, empty table used as a container for your DAX measures. This separates your calculations from your data columns, making your model much cleaner. They also have a special icon (a group of calculators) and always appear at the top of the Fields list.
- Display Folders: Within a measure table (or any table), you can group measures into folders. For example, you could have a "Core KPIs" folder and a "Time Intelligence" folder.
Part 3: Formatting DAX Code for Readability
Now let's look inside the formula bar. A simple measure like Total Revenue = SUM(Sales[Gross Sales]) is fine on one line. But as we start nesting functions, formatting becomes essential for understanding the logic.
The key tools for formatting are:
- Line Breaks:
Shift + EnterorAlt + Enter - Indentation:
Tabkey (andShift + Tabto un-indent) - Comments:
//for single-line comments or/* ... */for multi-line comments.
Let's watch an expert demonstrate these rules in action.
Learn to Format DAX (without DAX Formatter)
The video 'Learn to Format DAX (without DAX Formatter)' by Goodly provides a manual, step-by-step guide to formatting your code logically.
Watch from the beginning until 05:08. The video covers several formatting scenarios: The basic rule for simple, single-input functions. How to format functions with multiple inputs (like SUMX). How to indent nested functions (like SUMX inside CALCULATE). A convention for formatting VAR/RETURN blocks, which we'll use in later lessons.
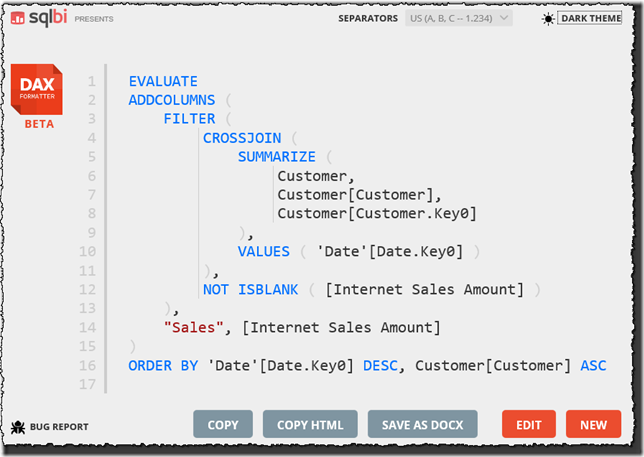
While you can format DAX manually, professionals often use external tools to do it instantly and consistently. The most popular is DAX Formatter by SQLBI. You simply paste your unformatted code and it returns a perfectly formatted version.
Your Turn: Applying Best Practices
Now it's time to clean up the measures in your Power BI file.
-
Create a Measure Table:
- On the Home tab in Power BI, click Enter data.
- A dialog will appear. Name the table
Key Measures. You don't need to add any data to the column. - Click Load.
- In the Fields pane, you will see your new
Key Measurestable with aColumn1.
-
Move Your Existing Measures:
- Go to the Model View (the third icon on the left-hand pane).
- In the Fields pane on the right, find the measures you created previously (
Total Revenue,Transaction Count,Total Profit, etc.), which are likely in yourSalestable. - Select one of your measures (e.g.,
Total Revenue). In the Properties pane below, change the Home table fromSalestoKey Measures. - Repeat this for all the measures you have created.
-
Finalize the Measure Table:
- Once all measures are moved, right-click on
Column1inside yourKey Measurestable and select Hide. - The table icon in the Fields pane should now change to the special measure table icon (a group of calculators), and it will jump to the top of your tables list.
- Once all measures are moved, right-click on
-
Review Naming and Formatting:
- Click on your
Profit Marginmeasure. - Make sure its name has a space:
Profit Margin. - In the formula bar, practice formatting the
DIVIDEfunction. Even though it's simple, apply the rule for multi-line functions:Profit Margin = DIVIDE( [Total Profit], [Total Revenue] ) - Review your other measures and ensure they follow the naming conventions we discussed.
- Click on your
Conclusion
Congratulations! This lesson might feel less about "doing analysis" and more about housekeeping, but these skills are what separate a good analyst from a great one. Clean, well-documented code is a hallmark of professionalism and will make your life much easier as you tackle more complex business problems.
Key Takeaways:
- Name for the Business: Use clear, descriptive names with spaces that a non-technical user can understand.
- Organize Your Model: Use Measure Tables to separate calculations from data, keeping your model clean and easy to navigate.
- Format Your Code: Use line breaks and indentation to make the logic of your DAX formulas clear, especially as they become more complex.
Preview of the Next Lesson:
We've now built a solid foundation of basic functions and best practices. In the next lesson, we will dive into the most important theoretical concept in DAX: Evaluation Context. You'll learn about Row Context and Filter Context, and understanding how they work is the key that unlocks the true power of DAX, especially the CALCULATE function. The formatting habits you built today will be invaluable as we start writing these more advanced formulas.