Hello! Welcome back to your DAX masterclass.
In our last lesson, we focused on the "housekeeping" of DAX—applying professional formatting and naming conventions. This was crucial preparation because we are now moving from the style of DAX to its core engine. This is where you'll start to understand the "why" behind the formulas.
This lesson introduces Evaluation Context, which is the most important concept for mastering DAX. There are two types of evaluation context, and today we'll focus on the first: Row Context. Your goal is to define 'Row Context' and identify scenarios where it is active (e.g., calculated columns, iterator functions). Understanding this concept is the first major step toward writing powerful and flexible DAX code.
What is Evaluation Context?
Before diving into Row Context, let's briefly define Evaluation Context. Think of it as the "environment" or "surroundings" in which a DAX formula is calculated. The context determines which data is visible to your formula, and therefore, what result it produces. Row context and its sibling, filter context, are the two components of this environment.
Part 1: Defining Row Context - The "Current Row"
The simplest way to think of Row Context is that it means "the current row." When a row context is active, DAX knows which specific row of a table it's working on, allowing it to access values from any column in that single row.
The most common place you'll see row context is in calculated columns.
Let's start with a foundational article from SQLBI, a leading authority on DAX. This will explain the concept of row context and show you how it works automatically in calculated columns.
Please read the introduction and the first main section, stopping before you reach the heading 'When there is no row context'. Focus on how the article defines row context as the 'current row' and uses the example of a simple calculated column to illustrate it.
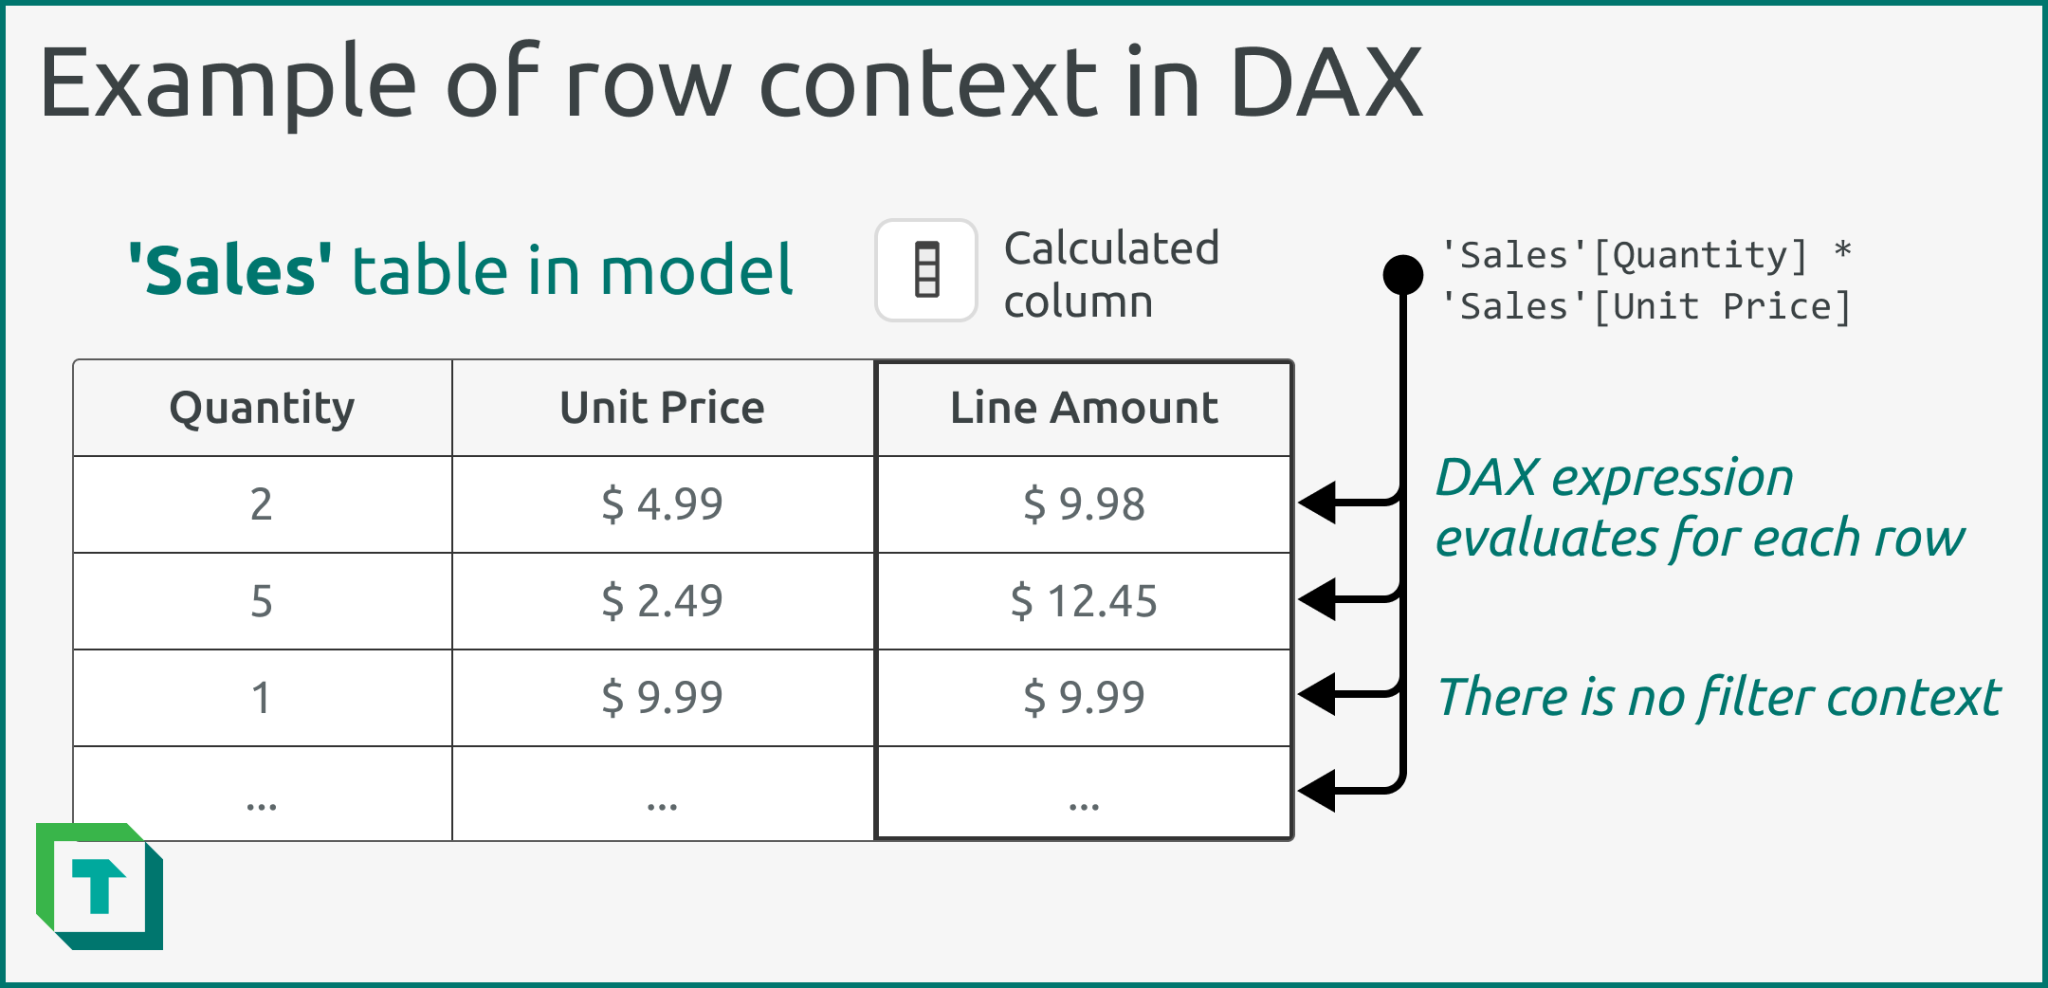
As the article explained, when you write a formula for a calculated column like Sales[Quantity] * Sales[Net Price], DAX automatically creates a row context. It iterates through the Sales table, row by row, performing the multiplication for each "current row" and storing the result.
This image perfectly visualizes the process. For each row, the DAX engine can see the values in that row's Quantity and Unit Price columns to compute the Line Amount.
Part 2: Where Row Context Doesn't Exist (And Why Measures Fail)
Now, let's try to use that same logic in a measure. If you create a new measure and type the exact same formula, Sales[Quantity] * Sales[Net Price], Power BI will give you an error.
Why? Because measures, by default, do not have a row context. A measure is designed to work over a whole column or table, often aggregating thousands of rows. When you write Sales[Quantity], you're not telling DAX which row's quantity you want. Is it the first row? The last? The average? Without a "current row," the request is ambiguous and the formula fails.
To understand this critical distinction, let's continue with the SQLBI article.
This next section of the article explains why the calculated column formula fails inside a measure and discusses the wrong way to fix it.
Please read the section titled 'When there is no row context'. Pay close attention to the error message Power BI generates and the explanation for why SUM(Sales[Quantity]) * SUM(Sales[Net Price]) produces a logically incorrect result.
This is a fundamental concept in DAX:
- A calculated column is evaluated for each row in the table. It has an innate row context.
- A measure is evaluated in the context of a visual or filter. It has no innate row context.
So, how do we perform row-by-row calculations inside a measure? We need to create a row context ourselves.
Part 3: Creating Row Context with Iterator Functions
To solve this problem, DAX provides a special class of functions called iterators. These functions are often identifiable by the "X" at the end of their name, such as SUMX, AVERAGEX, and COUNTX.
An iterator function does two things:
- It takes a table as its first argument.
- It then iterates through that table, row by row. For each row, it creates a temporary row context and evaluates an expression you provide.
Let's see this in action. The following video gives a fantastic visual explanation of how an iterator creates a row context within a measure.
Row Context - The Whiteboard #02
This SQLBI Whiteboard video provides a clear, graphical explanation of how row context is created and used by an iterator function like SUMX.
Please watch from 01:08 to 08:12. The first part (until 02:12) revisits the calculated column example. The main part demonstrates how SUMX works within a measure. Pay close attention to how the DAX engine first gets a table (which may be filtered by the report) and then the iterator creates a row context to go through that table, one row at a time. The final part explains why row context is so important: you can only reference a column directly when a row context is active.
To solidify what you just saw, let's read the final part of the SQLBI article which details the SUMX function.
This section provides the textual explanation for what you just saw in the video, detailing how to correctly write the formula using SUMX.
Please read the section 'Creating a row context with iterators'. This formally introduces SUMX and breaks down how it solves our problem by creating the row context we need inside a measure.
So, the correct measure for Total Revenue is:Total Revenue = SUMX(Sales, Sales[Quantity] * Sales[Net Price])
Here, SUMX iterates over the Sales table, and for each row, it multiplies Quantity by Net Price. After calculating all the individual row results, it sums them up to produce the final, correct total.
Your Turn: Experiencing Row Context
Let's apply these concepts in your Power BI file.
-
Create a Calculated Column (Implicit Row Context):
- Navigate to the Data View in Power BI and select your
Salestable. - Go to the Table tools ribbon and click New column.
- In the formula bar, enter the following DAX formula and press Enter:
Line Total = Sales[Quantity] * Sales[Unit Price] - Observe how a value is calculated for every single row. This is row context in action, provided automatically.
- Navigate to the Data View in Power BI and select your
-
Attempt to Create a Failing Measure:
- Go back to the Report View.
- In your
Key Measurestable, right-click and select New measure. - Try to use the same formula as before:
// This will produce an error Bad Revenue Measure = Sales[Quantity] * Sales[Unit Price] - Notice the error message. Power BI is telling you it cannot determine a single value for the columns because there is no row context.
-
Create the Correct Measure with an Iterator:
- Now, create the correct measure using
SUMX:Revenue (SUMX) = SUMX( Sales, Sales[Quantity] * Sales[Unit Price] ) - Create a card visual on your report canvas and add the
Revenue (SUMX)measure to it. You will see it calculates the correct total revenue by performing the multiplication for each row and then summing the results.
- Now, create the correct measure using
Conclusion
Excellent work! You've just grasped one of the most challenging but essential concepts in DAX. Understanding the presence (or absence) of row context is the key to debugging your formulas and moving beyond simple aggregations.
Key Takeaways:
- Row Context means "the current row" and allows DAX to see values in the columns of that specific row.
- Row context is automatically created in calculated columns.
- Measures do not have a default row context, which is why referring directly to a column in a measure causes an error.
- Iterator functions (like
SUMX) are used to manually create a row context inside a measure, enabling row-by-row calculations.
Preview of the Next Lesson:
Now that you understand row context, we're ready to explore its sibling: Filter Context. Filter context is created by your report visuals, slicers, and other DAX functions. In the next lesson, we will define filter context and see how it works together with row context to enable truly dynamic and powerful analysis.