Hello! Welcome back to our DAX journey.
In the last lesson, we demystified Row Context. We learned it means "the current row" and is the key to performing row-by-row operations, either automatically in calculated columns or manually using iterator functions like SUMX inside measures.
Today, we move to the second pillar of evaluation context: Filter Context. This is the invisible force that makes your Power BI reports so interactive and dynamic. Your learning outcome for this lesson is to define 'Filter Context' and describe how visuals and slicers propagate filters to measures.
By the end of this lesson, you'll understand the "magic" that happens when you click on a slicer or drag a field into a visual, and you'll see why a well-structured data model is absolutely essential for this magic to work.
Part 1: What is Filter Context?
Let's start with a definition. Filter Context is the set of all active filters applied to your data model before a DAX measure is calculated. These filters can come from many places in your report.
This image provides a great overview of the most common sources of filter context:
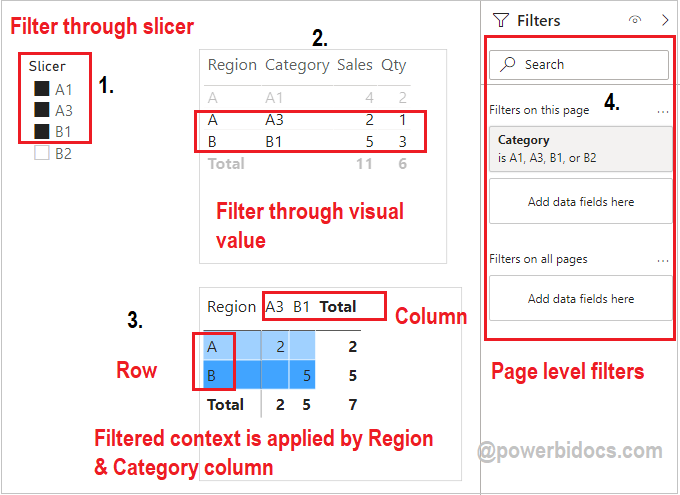
Essentially, every time you see a number in a Power BI visual, that number is the result of a measure being calculated within a specific filter context. A grand total has a very simple (often empty) filter context, while a specific cell in a detailed matrix has a much more complex one.
To get a clearer picture, let's watch the introduction from two excellent videos on the topic.
First, the experts at SQLBI will introduce the concept and emphasize how it differs from the row context we've already learned about.
Watch the first 1 minute and 28 seconds of this video. Focus on the core idea that filter context and row context are two completely different concepts, even though they can sometimes seem similar.
DAX Filter Context Basics [Full Course]
Next, let's get another clear, concise definition from Pragmatic Works. This helps solidify the core idea.
Watch from 04:59 to 06:10. The key takeaway here is the definition of filter context as 'the automatic filtering that's occurring through the active relationships in the data model.'
Part 2: How Visuals Create Filter Context
Now for the crucial part: how does this actually work? When you add a field to the rows or columns of a visual, Power BI uses the values in that field to create a filter context for each cell.
Let's see a practical demonstration.
The SQLBI video provides an excellent demonstration of a matrix visual creating and applying filter contexts for a measure.
Please watch from 02:44 to 07:10. Notice how the same Sales Amount measure produces different results as the filter context changes: First, as a grand total (no filters). Then, when 'Brand' is added to the rows (one filter per row). Finally, when 'Year' is added to the columns (two filters per cell). Pay close attention to the critical point made around the 6-minute mark: a row in a matrix defines a filter context, not a row context.
This distinction is vital and a common point of confusion for beginners. Remember from our last lesson:
- Row Context iterates a table and operates on a single row at a time.
- Filter Context filters the entire data model based on values from columns. A single filter context (like
Brand = "Contoso") can still "see" thousands of rows in theSalestable.
To solidify this, let's read a short article that visually represents the filter context of a single cell.
Filter context in DAX explained visually
This article from SQLBI visually breaks down all the filters that combine to create the context for one specific number in a matrix.
Please read the section titled 'Each cell has a different filter context'. Look at the image and see how the highlighted cell's value is determined by filters coming from the matrix row, the matrix column, and the slicer.
Part 3: How Filters Propagate Through Relationships
You might have noticed something interesting. In the examples, a filter on the Product table (e.g., Brand) or the Date table (e.g., Year) was able to filter the Sales table to calculate the Sales Amount. This doesn't happen by accident.
Filter context propagates through the relationships in your data model.
This is why we spent time in Module 2 setting up a proper star schema with fact and dimension tables. Filters are typically applied to dimension tables (like Products, Customers, Calendar), and those filters automatically flow "downhill" along the one-to-many relationships to filter your fact table (Sales).
Let's watch a demonstration of this in action.
DAX Filter Context Basics [Full Course]
This clip from Pragmatic Works clearly explains and shows how an active one-to-many relationship allows the filter context to work. It also shows what happens when that relationship is broken.
Watch from 08:15 to 15:32. Focus on: The explanation of the one-to-many relationship between Sales Territory and Sales. The visual demonstration of what happens when the relationship is deleted: the filtering stops working, and you see repeating total values. This reinforces the critical role of the data model.
The key principle is that filters propagate along active relationships, by default from the "one" side (dimensions) to the "many" side (facts). The little arrow on the relationship line in Power BI's Model view shows you the direction of this filter propagation.
Your Turn: Seeing Filter Context in Your Report
Let's put theory into practice in your Power BI file.
-
Start with the Grand Total:
- On a new page in your report, create a Card visual.
- Add your
[Total Revenue]measure to it. This value represents the measure calculated in an empty filter context; it's the total for the entireSalestable.
-
Create a Matrix with Row Filters:
- Create a Matrix visual.
- Add
Product[Category]to the Rows field. - Add your
[Total Revenue]measure to the Values field. - Notice how the total revenue is now broken down by category. Each row in the matrix has created a filter context (e.g.,
Product[Category] = "Accessories") and the measure is calculated within that specific context.
-
Add Column Filters:
- Now, drag
Calendar[Year]to the Columns field of your matrix. - Observe how each cell now represents the intersection of two filters. For example, the cell for "Bikes" and "2022" is calculating
[Total Revenue]within the filter contextProduct[Category] = "Bikes"ANDCalendar[Year] = 2022.
- Now, drag
-
Add a Slicer:
- Create a Slicer visual on the same page.
- Add
Customer[Country-Region]to the slicer's field. - Select "Canada" from the slicer. Watch how all the values in your matrix update. The slicer has added a third filter,
Customer[Country-Region] = "Canada", to the filter context of every single cell in the matrix.
This hands-on exercise demonstrates the power and automatic nature of the filter context.
Conclusion
Fantastic work today. You've now covered the two fundamental evaluation contexts in DAX. While Row Context is about iteration, Filter Context is about filtering. Mastering the interplay between these two is the true secret to becoming a DAX expert.
Key Takeaways:
- Filter Context is the set of active filters (e.g.,
Year = 2022,Brand = "Contoso") applied to the data model before a measure is evaluated. - Report elements like visual rows/columns, slicers, and other chart selections automatically create and combine to form the filter context.
- Every cell in a visual is calculated in its own unique filter context.
- Filters propagate from dimension tables to fact tables through active one-to-many relationships, which is why a good star schema is essential.
Preview of the Next Lesson:
So far, we have only let Power BI create the filter context for us automatically. But what if we want to calculate the sales for all products, ignoring the filter from the visual? Or what if we want to compare this year's sales to last year's? To do this, we need to be able to manipulate the filter context ourselves.
In our next lesson, we will introduce the single most important function in all of DAX: CALCULATE. This function is your key to unlocking the full analytical power of DAX by giving you complete control over the filter context.