Hello! Welcome back to our DAX course.
In our last lesson, we defined Filter Context and saw how it's automatically created by your report visuals, slicers, and their relationships. You learned that every number in a Power BI report is the result of a measure being calculated within a unique filter context.
Today, we take the next logical step. Instead of just observing filter context, you will learn to actively predict its effect. The goal for this lesson is to predict the result of a simple measure given a specific filter context from a visual. This skill is fundamental because it means you are starting to "think like DAX," which is crucial for both writing and debugging complex formulas later on.
Part 1: The DAX Evaluation Engine - A 3-Stage Process
To accurately predict a measure's result, you need a mental model of how the DAX engine works. Whenever Power BI needs to display a value in a visual, it follows a consistent three-stage process for each and every cell.
- Identify the Filter Context: The engine first looks at the cell's coordinates in the visual (e.g., the "Bikes" row, the "2022" column) and any other active filters (e.g., from slicers) to determine the complete set of filters to apply.
- Filter the Data Model: It then applies this entire filter context to your data model. You can imagine it creating a temporary, "shrunken" version of your tables that only contains the data matching the filters.
- Calculate the Expression: Finally, the engine executes the DAX expression of your measure, but only on this shrunken, filtered view of your data. The result is then returned to the visual.
Let's watch a video that explains and demonstrates this process perfectly.
Master Filter Context in Power BI – From Basics to Expert
The video 'Master Filter Context in Power BI' by Goodly provides a clear, step-by-step walkthrough of this three-stage process for a simple visual.
Watch the beginning of the video, from 00:00 to 04:52. Pay close attention to how the presenter: Identifies the filter context for a single cell (Region = East). Applies that filter to the underlying table. Performs the calculation on the filtered data. Even verifies the result manually in Excel, proving the logic.
This three-stage process is the bedrock of predicting DAX behavior.
Part 2: Deconstructing a Complex Filter Context
In a real-world report, the filter context for a single value is rarely just one filter. It's usually a combination of filters coming from multiple sources simultaneously.
Take a look at the following image. It shows a single sales value, "10.0K", and breaks down all the individual filters that combined to produce that number.
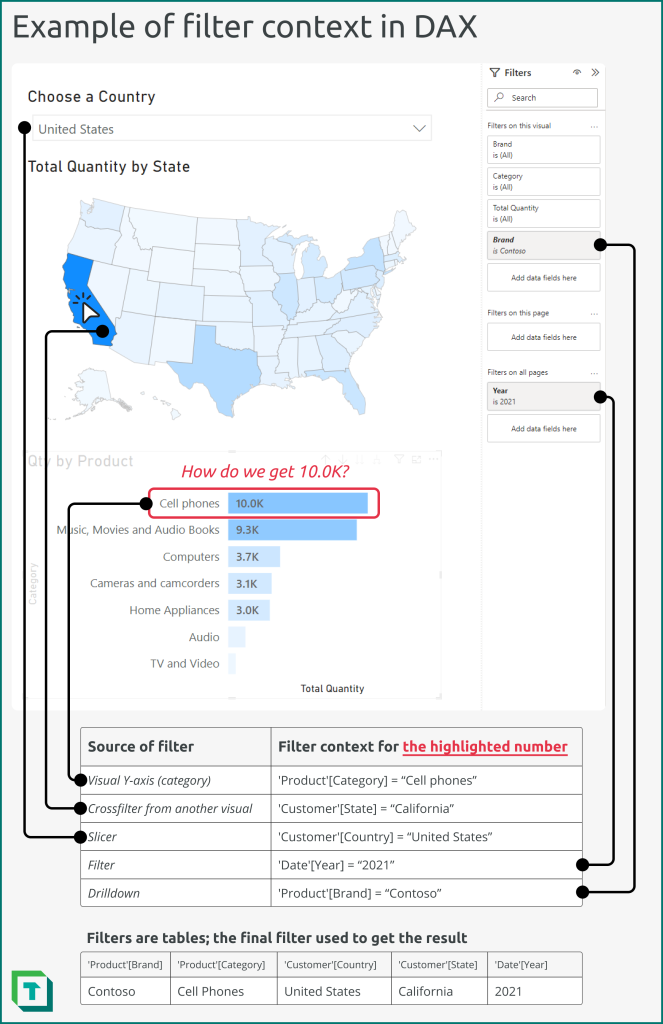
To predict a DAX result, you must first be able to identify all these contributing filters. A powerful way to conceptualize this is to think of each filter as a small table of allowed values. The total filter context is the intersection of all these small filter tables.
The following video from SQLBI provides an excellent visual representation of this idea.
Filter context in DAX explained visually
The video 'Filter context in DAX explained visually' shows how to think about and represent the filter context as a collection of filter tables.
Watch from 00:57 to 03:27. Focus on how the presenter analyzes a single cell in a matrix and visually breaks down the filter context into four separate 'filter tables': one for Brand, one for Color, one for Year, and one for Country (from a slicer).
Part 3: Tracing the Filter's Path Through Relationships
There's one more piece to the puzzle. As we saw last lesson, filters often start on a dimension table (like Products) but need to affect the fact table (Sales) where the calculation happens. This "travel" occurs through the relationships in your data model.
When predicting a result, you must also trace this path. A filter on Product[Category] = "Bikes" doesn't just filter the Products table; it flows along the relationship to the Sales table, ensuring that the [Total Revenue] measure only sees sales transactions for bikes.
Let's see a clear demonstration of this filter propagation.
Master Filter Context in Power BI – From Basics to Expert
Let's return to the Goodly video, which now shows how filter context works with a star schema involving two tables.
Watch from 05:20 to 08:38. The key insight here is how two filters, Region = East (from the Sales table) and Category = Accessories (from the Products table), work together. Notice how the filter on the Products table first finds the relevant Product Keys, which then travel through the relationship to filter the Sales table.
Part 4: Your Turn - The Prediction Challenge
Now it's time to apply the "theory -> example -> application" framework. Let's use your own Power BI report to practice predicting a result.
Follow these steps in your PBIX file:
-
Set Up the Visual:
- Go to a new, blank page in your report.
- Create a Matrix visual.
- Drag
Product[Category]to the Rows. - Drag
Customer[Country-Region]to the Columns. - Drag your
[Total Revenue]measure to the Values.
-
The Challenge:
- Look at the matrix you just created. Find the cell at the intersection of the "Bikes" category and the "United States" country-region.
- Your task: Before looking closely at the number, try to predict it. Think through the three-stage process:
- Stage 1: Identify Context. What are the two filters for this cell?
- Stage 2: Filter Model. Mentally, how do these filters shrink your data? The
Producttable is filtered to bikes, and theCustomertable is filtered to the United States. How do these filters propagate to theSalestable? - Stage 3: Calculate. On that doubly-filtered
Salestable, what is theSUMof theLine Totalcolumn?
-
Verify Your Prediction:
Now, let's confirm the value manually, just like in the first video. This is an invaluable skill for debugging.- Go to the Data view in Power BI (the grid icon on the left).
- Select the Sales table.
- Open the Filters pane on the right.
- You won't see
Product[Category]orCustomer[Country-Region]directly, because they are in other tables. This is where relationships are key! - Scroll the list of filter fields until you find the fields from your related tables.
- Under the
Producttable section in the filter pane, find Category. Select "Bikes". - Under the
Customertable section, find Country-Region. Select "United States". - Now, look at the bottom status bar of Power BI. It will tell you the number of rows remaining in the
Salestable after filtering. - You can't see the sum of a column here, but you have now perfectly replicated the filter context for that cell. The
[Total Revenue]measure is simply summing theLine Totalfor these specific rows. Does the value in your matrix match what you'd expect from this filtered data?
This exercise takes you from being a passive user of DAX to an active analyst who understands what the engine is doing under the hood.
Conclusion
Great job today! You've transitioned from knowing what filter context is to understanding how it produces a result. This ability to predict outcomes is a major step forward in your DAX proficiency.
Key Takeaways:
- DAX calculates measures in a three-stage process: identify the context, filter the model, then execute the calculation.
- The filter context for a single cell is a combination of all active filters from the visual's rows, columns, slicers, and more.
- To predict a result, you must trace the filters as they propagate through relationships from dimension tables to your fact table.
- You can manually verify a filter context by using the Filters pane in the Data view to replicate the filters applied to a visual.
Preview of the Next Lesson:
Today, we focused on predicting the correct result. But what happens when Power BI gives you a strange or unexpected number? How do you figure out what went wrong? In our next lesson, we will explore why mastering evaluation context is critical for debugging DAX. You'll see how the prediction skills you learned today become your primary tool for diagnosing and fixing faulty formulas.