Hello! Welcome to the second-to-last lesson in our DAX mastery course.
In our previous lesson, we enhanced the user experience of our report by creating dynamic titles that update based on user selections. This was a great step in making our report more interactive and professional.
Today, we're going to take a step back and focus on the quality and maintainability of our work. Throughout this course, we've written many DAX measures. Now, it's time to review and refine them according to professional best practices. Think of this as the final polishing step a data analyst performs before sharing their work with stakeholders. It ensures that anyone (including your future self!) can easily understand, debug, and build upon your code.
Our goal for this lesson is to learn and apply a DAX quality checklist to review our existing measures for clarity, formatting, and the consistent use of variables.
Why DAX Code Quality Matters
Before we dive into the checklist, it's important to understand why we're doing this. Writing clean code isn't just about making it look nice; it has practical benefits that save significant time and prevent errors.
How to Format DAX Code in Power BI
To understand the core motivations behind this lesson, please read the introduction of the article 'How to Format DAX Code in Power BI' from the Graphed Blog.
Read the sections titled 'Why Does DAX Formatting Matter?', including its subsections on Readability, Easier Debugging, Simplified Maintenance, and Better Collaboration. This will set the stage for the specific techniques we'll cover next.
As the article highlights, well-structured DAX is easier to read, debug, and maintain. This is a crucial habit for any serious data analyst.
The DAX Quality Checklist
Let's build a checklist of best practices that you can use to review your DAX code.
1. Is the Code Well-Formatted?
Unformatted DAX is notoriously difficult to read. Proper formatting visually separates the logical parts of your formula, making its structure immediately apparent.
Key Formatting Rules:
- Line Breaks & Indentation: Start each new function on a new line and indent its arguments. Use Shift + Enter for a new line and Tab to indent in the Power BI formula bar.
- Capitalization: Write all DAX function names in
UPPERCASE(e.g.,SUM,CALCULATE). - Object Naming: Use
[Measure Name]for measures,'Table Name'[Column Name]for columns, and'Table Name'for tables (the single quotes are only required if the table name has spaces, but it's a good habit).
This video from Enterprise DNA reinforces these points and introduces the value of code comments, which we'll discuss next.
DAX Calculations - Power BI Best Practices Vol. 3
This video discusses several best practices. Pay close attention to the segments on formatting and commenting.
Watch from 03:38 to 06:07. The speaker emphasizes the importance of formatting and demonstrates using an external tool (like DAX Formatter) to automate it. He also provides great context on how to write useful comments.
Manually formatting code can be tedious. Professional analysts use automated tools. The most popular one is the free web tool from SQLBI.
- Tool: DAX Formatter
You simply copy your DAX code, paste it into the website, click "Format", and paste the clean version back into Power BI.
2. Are Variables (VAR/RETURN) Used Effectively?
We've used variables (VAR) in many of our previous lessons. They are one of the most powerful tools for improving DAX code.
Benefits of Variables:
- Readability: They break complex calculations into logical, named steps.
- Debugging: You can temporarily change the
RETURNstatement to output the result of any variable, making it easy to check intermediate steps. - Performance: A variable is calculated only once. If you need the same result multiple times in your measure, using a variable prevents redundant calculations.
This next video from SQLBI provides an excellent, in-depth explanation of why and how to use variables.
This video is a masterclass on using variables. It clearly demonstrates how they improve readability and structure.
First, watch from the beginning to 03:40 to see a clear 'before and after' example that transforms a hard-to-read measure into a clear one. Then, watch the summary from 15:23 to 16:43, which provides a strong rule of thumb: 'When in doubt, use a variable.'
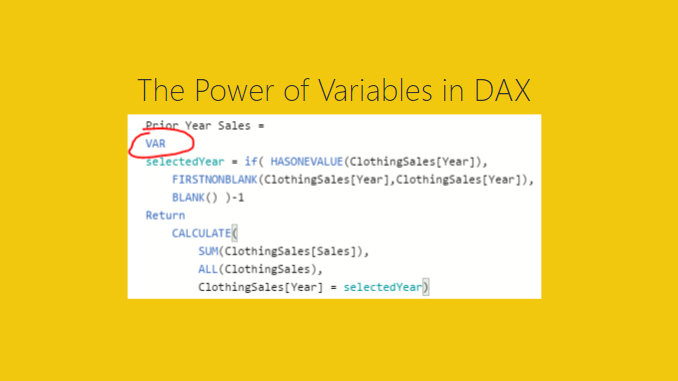
A crucial concept to remember is that a DAX variable is a constant. It is evaluated once when it is defined, and its value does not change, even if the filter context changes later in the measure. Misunderstanding this can lead to incorrect results.
3. Are Naming Conventions Logical and Consistent?
The names you give your tables, columns, and measures have a huge impact on usability for both you and the end-users of the report.
The article from DATA GOBLINS provides an excellent checklist for overall model hygiene. We'll focus on the section about naming conventions.
Read the section titled 'ARE OBJECT NAMES LOGICAL, CONCISE & CONSISTENT?'. Pay attention to the tips on being consistent, using business terminology, and balancing clarity with conciseness.
In addition to the points in the article, remember this fundamental DAX rule:
- Always fully qualify column names with their table name:
'Sales'[Revenue]. - Never qualify measure names with a table name. Just use
[Total Sales], not'Measure Table'[Total Sales]. Measures are global to the model, even if you store them in a specific table for organization.
4. Is the Model Organized?
A clean model isn't just about clean code; it's also about organization. As your report grows, your list of measures can become long and difficult to navigate.
- Use Measure Tables or Display Folders: Group related measures together. For example, you can create a
_Time Intelligencefolder for all your YTD and MoM calculations, and a_Key Measuresfolder for core KPIs. You can create folders by selecting one or more measures in the Model View and typing a folder name into the "Display folder" property. - Hide Technical Fields: Some fields and measures are not meant for the end-user. This includes relationship keys (e.g.,
Sales[ProductKey]) and "helper" measures (like the hex code measure for conditional formatting we created). Hiding them from the Report View declutters the Fields pane and prevents confusion. You can hide a field by right-clicking it in the Data pane and selecting "Hide in report view".
Your Turn: The DAX Code Review
Now it's time to apply these principles. Your task is to open your Power BI project file and conduct a full code review of all the measures we've created throughout this course.
Use the following checklist for each measure:
-
Formatting:
- Is the code properly formatted with line breaks and indents?
- Copy the code, paste it into DAX Formatter, and replace the old code with the clean version.
-
Variables:
- Does the measure use variables for complex or repeated logic?
- If you see a long, nested formula, can you refactor it using
VAR/RETURNto make it more readable?
-
Naming:
- Is the measure name clear, concise, and consistent with other measure names? (e.g.,
Total Sales,Total Cost,Profit Margin). - Are all column references fully qualified (e.g.,
'Sales'[Revenue])? - Are all measure references unqualified (e.g.,
[Total Sales])?
- Is the measure name clear, concise, and consistent with other measure names? (e.g.,
-
Comments:
- If the measure contains particularly complex business logic, add a comment (
// This part does...) to explain the intent or "why" behind the code.
- If the measure contains particularly complex business logic, add a comment (
-
Organization:
- Once you've reviewed the measures, create a few Display Folders to group them. For example:
Key Measures,Time Intelligence,Dynamic Visuals. - Find the conditional formatting hex code measure you created in the previous lesson and hide it from the report view.
- Once you've reviewed the measures, create a few Display Folders to group them. For example:
This exercise is the most important part of the lesson. Take your time to thoughtfully apply these best practices to your own work.
Conclusion
Congratulations on completing this crucial lesson on code quality! You've moved beyond just writing DAX that works to writing DAX that is professional, maintainable, and scalable. These practices are what separate novice Power BI developers from experts.
Key Takeaways:
- Formatting is Non-Negotiable: Use line breaks, indentation, and tools like DAX Formatter to make your code readable.
- Variables are Your Best Friend: Use
VAR/RETURNto improve readability, debugging, and performance. - Be Consistent: Apply logical naming conventions for all objects in your model.
- Organize Your Model: Use display folders and hide technical fields to create a clean and user-friendly experience.
Preview of the Final Lesson:
We have now reached the final lesson of our course! In our next session, we will tackle the last piece of the puzzle: performance. You will learn how to use Power BI's built-in Performance Analyzer to identify slow-running visuals and DAX queries, giving you the skills to diagnose and fix performance bottlenecks in your reports.