Hello! Welcome to the final part of our DAX course. This lesson completes our module on finalizing and optimizing your Power BI reports.
In the previous lesson, we explored the theory behind DAX performance. You learned to identify common pitfalls like the overuse of calculated columns, inefficient iterators, and improper use of FILTER, all of which force the DAX engine to use its slower Formula Engine instead of the highly optimized Storage Engine.
Today, we move from theory to practice. It's one thing to know what causes slow DAX, but it's another to find it in a complex report. This lesson will teach you how to use a critical built-in tool, the Power BI Performance Analyzer, to diagnose your reports, pinpoint slow visuals, and extract the exact DAX queries that are causing the bottlenecks. Mastering this skill is the final step in becoming a proficient and professional data analyst.
Introducing the Performance Analyzer
The Performance Analyzer is your first line of defense when a report feels sluggish. It records the time it takes for every visual on a page to execute its DAX query, render itself on the screen, and perform other background tasks. This allows you to stop guessing and start making data-driven decisions about where to focus your optimization efforts.
To get a comprehensive overview of this tool, let's start with a video from the experts at SQLBI.
Introducing Performance Analyzer in Power BI Desktop
This video, 'Introducing Performance Analyzer in Power BI Desktop' by SQLBI, provides a foundational tour of the tool. It explains its purpose and demonstrates how to start a recording and interpret the basic results.
Please watch from the beginning up to 06:03. Focus on understanding: The purpose of the Performance Analyzer. How to start a recording and capture data by interacting with the report. The three main timing categories: 'DAX query', 'Visual display', and 'Other'.
How to Use the Performance Analyzer: A Step-by-Step Guide
As you saw in the video, using the Performance Analyzer involves a simple, repeatable process. Let's formalize those steps.
- Open the Pane: In Power BI Desktop, navigate to the View tab in the ribbon and check the box for Performance Analyzer. This will open a new pane on the right side of your screen.
- Start Recording: Click the Start recording button within the Performance Analyzer pane. From this point on, Power BI will log the performance data for any action that causes visuals to update.
- Interact with the Report: To generate performance logs, you need to trigger a visual refresh. You can do this in two main ways:
- Click Refresh visuals in the Performance Analyzer pane. This refreshes everything on the page and is the best way to get a clean baseline measurement.
- Interact with the report as a user would: click on a slicer, cross-filter by selecting a data point in a chart, or switch to a different page.
- Review the Logs: As you interact with the report, each visual's performance data will appear in the pane. You can sort the visuals by duration to quickly find the slowest ones.

Interpreting the Results: Where Is the Time Being Spent?
The most critical skill is interpreting the breakdown of the duration for each visual. The total time is split into three categories, and understanding them is key to knowing what to fix.
Identify Power BI Performance Bottlenecks Using the ... - B EYE
The article 'Identify Power BI Performance Bottlenecks' from B-EYE offers a clear, concise explanation of the performance metrics and how to diagnose issues based on them.
Please read the sections 'Interpreting Power BI Performance Analyzer Results' and 'Diagnosing Common Bottlenecks'. Focus on the descriptions of 'DAX Query Time' and 'Visual Display Time', and the guidance on how to prioritize your optimization efforts based on which of these is higher.
To summarize the key points from the article:
-
DAX Query: This is the time the engine spent running the DAX code to fetch the data for the visual.
- High DAX Query time is a red flag. It points directly to the performance pitfalls we discussed in the last lesson: inefficient measures, complex iterators, or a poorly structured data model. This is where you will focus most of your DAX optimization efforts.
-
Visual Display: This is the time Power BI spent drawing the visual on the screen after the data was retrieved.
- High Visual Display time suggests the problem isn't the DAX but the visual itself. This can be caused by plotting too many data points (e.g., a scatter plot with 50,000 dots), using a graphically intensive or poorly coded custom visual, or simply having too many visuals on one page. The fix here is to simplify the visual, not rewrite the DAX.
-
Other: This measures time spent waiting for other operations to complete or preparing the query. As a general rule, you should focus your analysis on
DAX QueryandVisual Displayand largely ignore theOthercategory, as it often reflects waiting time that you cannot directly optimize.
From Diagnosis to Solution: Finding the Slow Query
Once the Performance Analyzer helps you identify a visual with a high DAX Query time, the next step is to get the actual DAX code so you can analyze and fix it.
The following video from Guy in a Cube demonstrates this exact workflow.
My CHECKLIST for troubleshooting Power BI Performance
This clip from 'My CHECKLIST for troubleshooting Power BI Performance' shows the practical process of using the Performance Analyzer to find a slow visual and then drilling down to the DAX query.
Watch from 09:56 to 11:56. Observe how he starts recording, interacts with the report, identifies a slow matrix visual, and expands it to confirm that the 'DAX query' is the problem. This is the core diagnostic loop you will use.
After you expand a visual's details in the Performance Analyzer, you have two options to get the code:
- Copy query: This copies the DAX query to your clipboard. You can then paste it into a tool like DAX Studio for in-depth analysis of the query plan and server timings.
- Run in DAX Query View (New Feature): This is a powerful new integration. It sends the query directly to the DAX Query View within Power BI Desktop, allowing you to run and analyze it without leaving the application.
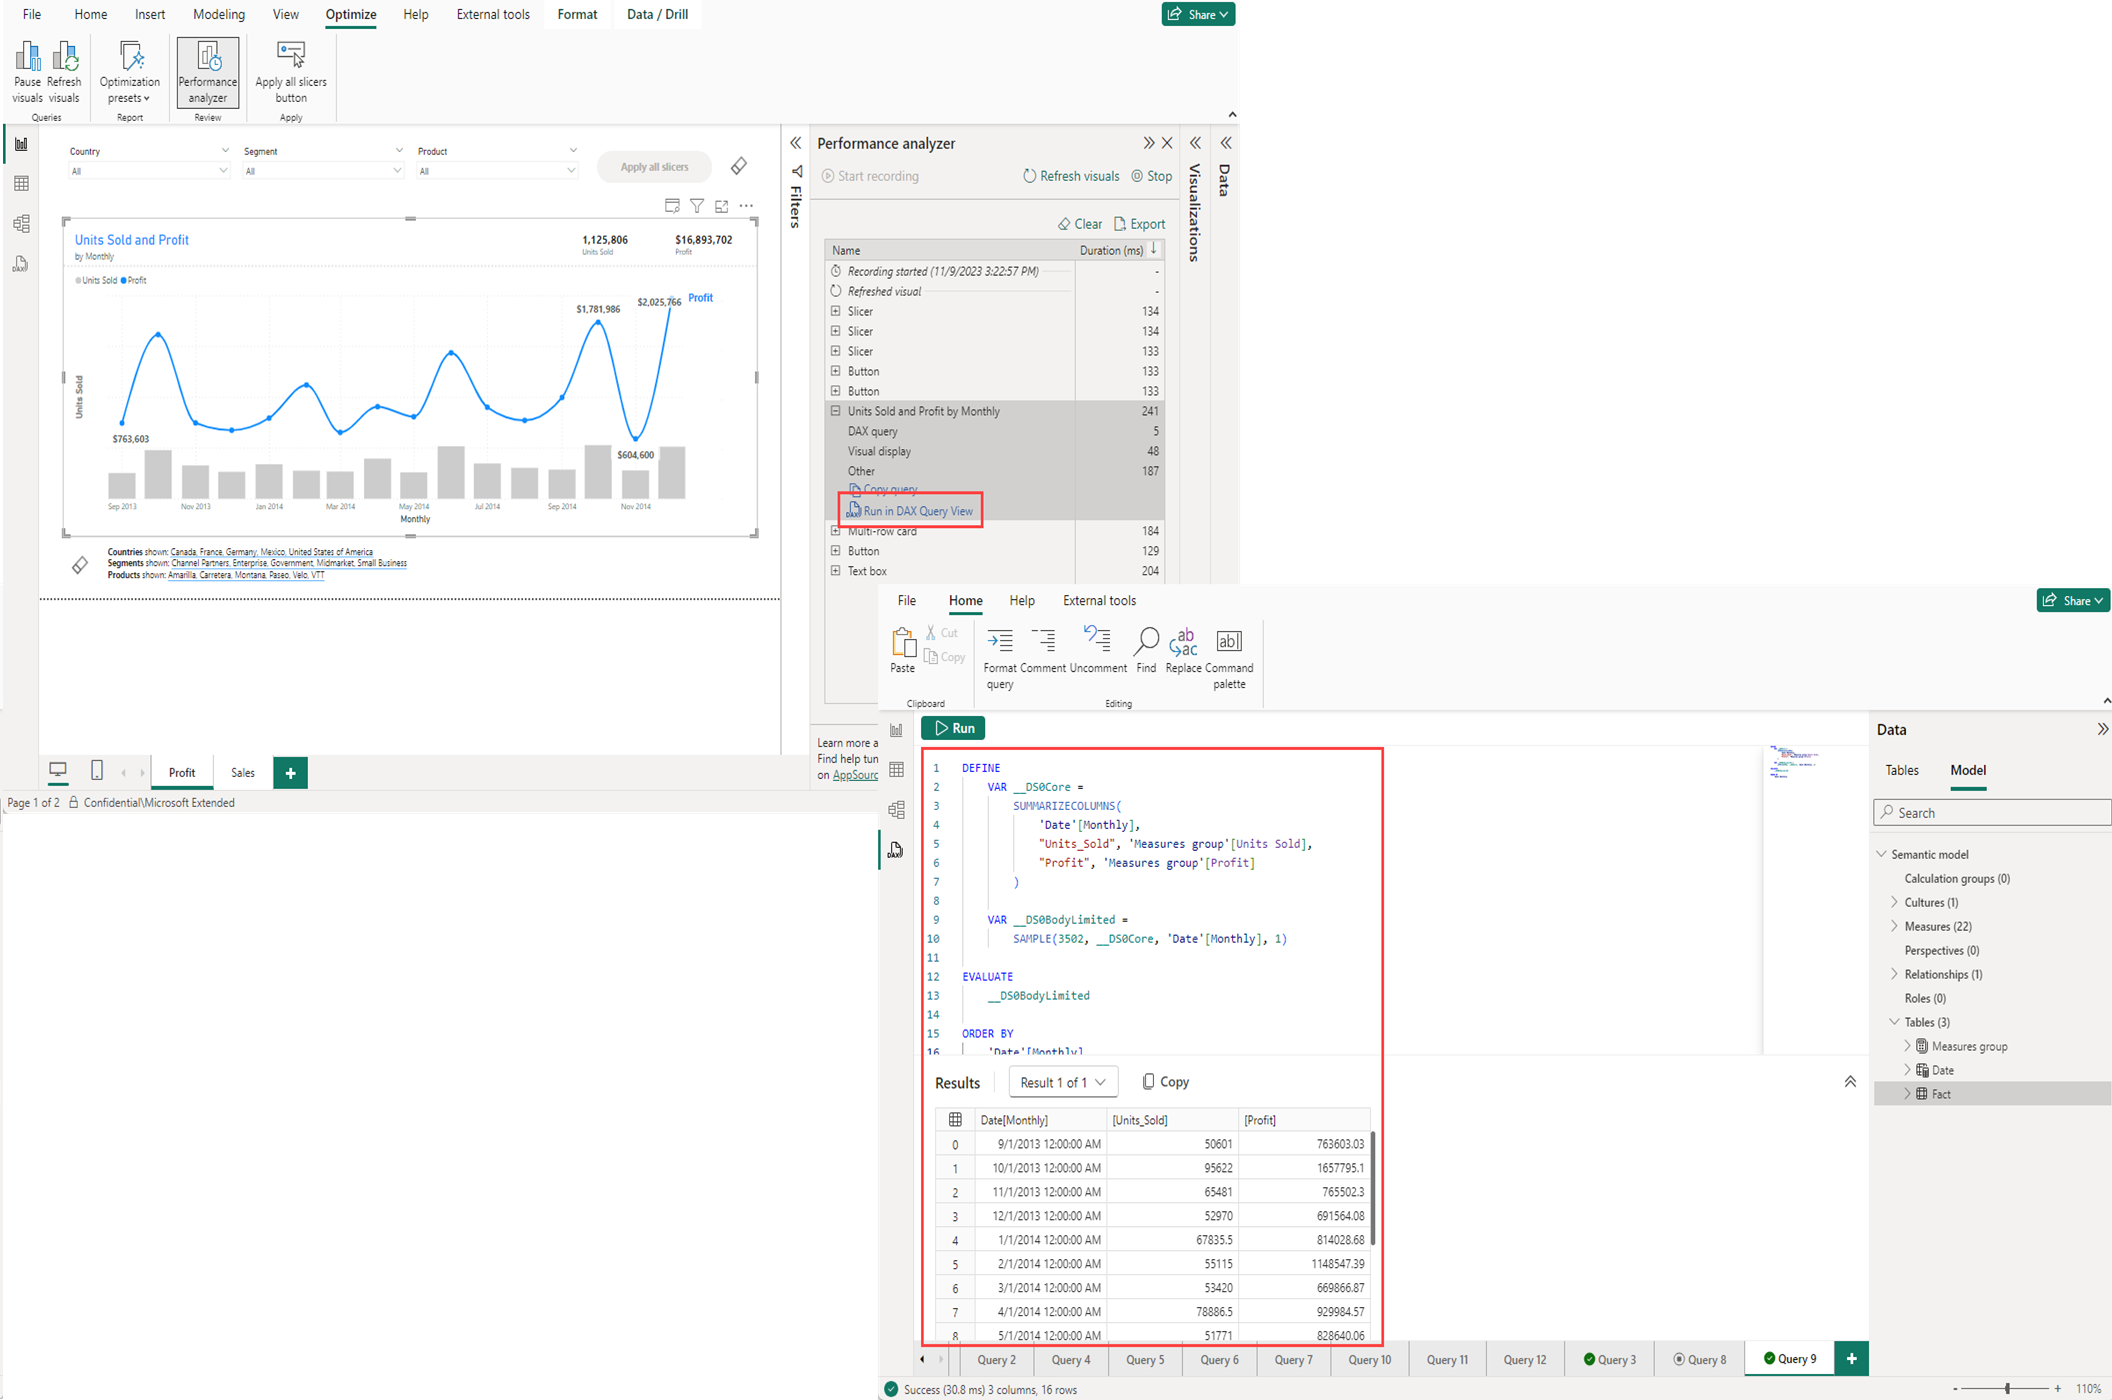
This process closes the loop:
Report is Slow -> Use Performance Analyzer -> Identify Slow Visual -> Confirm High DAX Query Time -> Extract Query -> Analyze and Optimize DAX.
A Real-World Example
Let's ground this with a quick case study that shows the business impact of this skill.
Identify Power BI Performance Bottlenecks Using the ... - B EYE
The B-EYE article you read earlier concludes with a brief but powerful case study that illustrates how this entire process comes together to solve a real business problem.
Please read the short 'Brief Case Study: How a Quick Diagnosis Saved Hours' section. Notice how they used the Performance Analyzer to find one slow measure that, once fixed, dramatically improved the entire report.
This example is a perfect illustration of the 80/20 rule in performance tuning. Often, a small number of inefficient measures are responsible for the majority of a report's slowness. The Performance Analyzer is the tool that helps you find them.
Course Conclusion
Congratulations! You have now completed your journey through DAX, from the fundamental building blocks to the advanced techniques of optimization and performance tuning. You have followed the complete workflow of a professional data analyst: from defining a business problem, to building a robust data model, writing powerful calculations, and finally, ensuring the end result is both accurate and efficient.
Key Takeaways from This Lesson:
- The Performance Analyzer is the primary tool for diagnosing slow Power BI reports.
- The analysis process is to Record, Interact, and Review.
- Focus on the DAX Query and Visual Display timings to understand the root cause of a bottleneck. High
DAX Querytime means your DAX needs optimization. - Use the Copy query or Run in DAX Query View features to extract the DAX from a slow visual for analysis and improvement.
You started this course with the goal of enhancing your DAX skills to a professional level. By progressing through data modeling, evaluation context, CALCULATE, time intelligence, and finally optimization, you have built a comprehensive and highly valuable skill set. You are now well-equipped to tackle complex analytical challenges and deliver high-performing, insightful reports.
Thank you for your dedication throughout this course. I wish you the very best in your career as a data analyst and beyond. Keep building, keep learning, and keep creating value with data.