Hello! Welcome to our second-to-last lesson in this DAX mastery course.
In our previous lesson, we brought our report to life by using DAX measures to apply dynamic conditional formatting. You learned how to write a measure that returns a hex color code, allowing you to create visuals that instantly communicate performance status.
Today, we'll add another layer of professionalism and clarity to our report by creating dynamic titles. Imagine a chart title that automatically updates to say "Sales for Beverages" when a user selects "Beverages" from a slicer, or "Total Sales for All Categories" when nothing is selected. This provides crucial context and makes your report significantly more user-friendly.
By the end of this lesson, you will be able to write a DAX measure that provides a dynamic title for a visual based on the user's selections.

Step 1: Understanding the Core DAX Function: SELECTEDVALUE
To get the value a user picks from a slicer, we need a function that can read that selection from the filter context. The primary function for this job is SELECTEDVALUE. It's designed to return a value only when a single, unambiguous choice has been made.
Let's start with the theory behind this essential function.
This article from Let's Viz provides a clear and concise overview of the SELECTEDVALUE function. It explains its purpose, syntax, and how it behaves.
Please read the sections 'Purpose', 'How Does SELECTEDVALUE Dax Works', 'What Does It Return?', and the 'Basic Usage' and 'With Alternate Result' examples. Focus on understanding why it returns a value only for a single selection and what the optional AlternateResult parameter does.
As you read, SELECTEDVALUE is essentially a shortcut for IF(HASONEVALUE(...), VALUES(...), AlternateResult). This makes it perfect for our initial goal: capturing a single slicer selection.
Step 2: Creating and Applying a Basic Dynamic Title
Now that you understand the theory, let's put it into practice. We'll create our first dynamic title measure and apply it to a visual.
The process involves two key steps:
- Writing a DAX measure that combines static text (like "Sales for ") with the dynamic value from
SELECTEDVALUE. - Connecting this measure to the visual's title property using the conditional formatting (
fx) button.
The following video provides a complete walkthrough of this process, including how to handle a common pitfall where the selected value is a number instead of text.
DYNAMIC TITLES based on SLICER SELECTION in Power BI
This video from 'How to Power BI' clearly demonstrates how to build and apply a dynamic title measure. Pay close attention to how the measure is constructed and where to click in the interface to apply it.
Watch the video from 00:35 to 04:16. The first part shows the creation of a basic measure for a text-based slicer. The second part explains why a numeric value (like a year) won't work directly and how to convert it to text.
To apply the measure, you'll need to find the conditional formatting button for the title. It's located in the Format your visual pane under General > Title > Text.
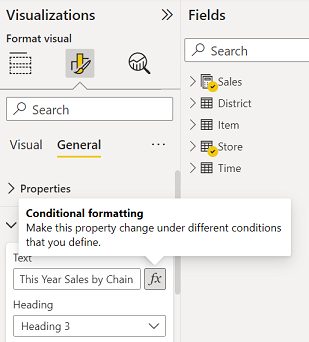
Step 3: Handling Multiple Selections and No Selections
Our basic measure works great for a single selection, but what happens if a user selects multiple items, or clears the slicer entirely? In both cases, SELECTEDVALUE returns a blank, and our title will look incomplete.
A professional report must handle these scenarios gracefully.
- No Selection: The title should display a default message, like "Sales for All Categories".
- Multiple Selections: The title should list the selected items, for example, "Sales for Laptops, Desktops".
To achieve this, we need to introduce two more functions:
CONCATENATEX: This iterator function builds a string by joining together the values from a table (in our case, the list of selected categories).ISFILTERED: This function checks if a column is currently being filtered, which tells us if the user has made any selection in the slicer.
The next segment of the video you started watching explains exactly how to enhance our measure to handle these situations.
DYNAMIC TITLES based on SLICER SELECTION in Power BI
Let's continue with the 'How to Power BI' video to learn how to build a more robust measure that handles both multiple and no selections.
Watch the video from 04:16 to 09:20. The first part (ending at 08:03) introduces CONCATENATEX and even shows how to use a Quick Measure to generate code that truncates long lists with 'etc.'. The second part (starting at 08:03) shows how to use ISFILTERED to display a custom message when no slicer selection is active.
By combining these functions with IF logic and variables, you can create a single, powerful measure that handles all user interactions correctly.
Your Turn: Create a Dynamic Title
Now it's time to apply what you've learned to our sales report. Your task is to create a dynamic title for the main line chart showing sales over time.
-
Create a Slicer: If you don't already have one, add a slicer to your report page for the
Product[Category]column. -
Write the DAX Measure: Create a new measure named
Dynamic Chart Title. This measure should return:"Total Sales for [Selected Category]"if one category is selected."Total Sales for All Categories"if no categories are selected."Total Sales for Multiple Categories"if more than one category is selected. (For an extra challenge, try usingCONCATENATEXto list them!)
Hint: You can structure your measure with variables and an
IForSWITCHstatement.Dynamic Chart Title = VAR SelectedCount = DISTINCTCOUNT('Product'[Category]) VAR SingleSelection = SELECTEDVALUE('Product'[Category]) RETURN SWITCH(TRUE(), SelectedCount = 1, "Total Sales for " & SingleSelection, ISFILTERED('Product'[Category]), "Total Sales for Multiple Categories", "Total Sales for All Categories" ) -
Apply the Measure:
- Select your line chart.
- Go to Format your visual > General > Title.
- Click the fx button for the Text property.
- In the dialog, set Format style to "Field value" and select your
[Dynamic Chart Title]measure. - Click OK.
Test your work by selecting one category, multiple categories (by holding Ctrl and clicking), and clearing the slicer. The title of your chart should update perfectly with each interaction.
Conclusion
Excellent work! You've just added a feature that significantly improves the user experience of your report. Dynamic titles provide immediate, clear context, which is a hallmark of a well-designed and professional dashboard.
Key Takeaways:
SELECTEDVALUEis the primary function for capturing a single user selection from a slicer.- For a robust title, you must handle three scenarios: single selection, no selection, and multiple selections.
CONCATENATEXis used to create a text list from multiple selected items.ISFILTEREDor counting distinct values helps you determine which scenario is active.- The dynamic title is applied through the conditional formatting (
fx) option on the visual's Title property.
Preview of the Next Lesson:
We have now reached the final lesson of our course! In our next session, we will focus on finalizing and optimizing our work. You'll learn how to review your measures for clarity and consistency, identify common performance pitfalls, and use Power BI's built-in Performance Analyzer to find and debug slow-running DAX queries. This will be the final step in preparing your report for a real-world business audience.