Hello! Welcome to the final module of our DAX course.
In our last lesson, we created a Performance Status measure that translated numerical variance into clear, descriptive text like 'On Target' or 'Below Target'. This was a huge step in adding business context to our report.
Today, we'll make our report even more intuitive by bringing it to life with color. Instead of just telling stakeholders what happened with text, we'll show them with dynamic visuals. This lesson covers how to write a DAX measure that returns a specific color based on performance, and then how to apply that color to your charts and tables. This is a fundamental technique for creating professional, at-a-glance dashboards.
By the end of this 60-minute lesson, you will be able to write a DAX measure that provides the correct hex color code for dynamic conditional formatting in your visuals.
Why Use DAX for Conditional Formatting?
Power BI has built-in conditional formatting options (e.g., "color scales" or "rules"), but they can be somewhat rigid. For example, setting up more than two rules can feel clunky, and applying the same logic across many different visuals requires repetitive setup.
A far more powerful and flexible approach is to use a DAX measure to control the color. This method, often called the "Field Value" method, lets you:
- Write complex business logic once.
- Reuse that logic across any visual.
- Update the color scheme for your entire report by changing just one measure.
This short video introduces the concept and highlights why using a measure is a superior technique.
Power BI Conditional formatting using Measures
Watch the beginning of this video from Access Analytic to see a quick demonstration of the power and flexibility of using DAX measures for conditional formatting.
Watch the first 43 seconds of the video (00:00 - 00:43). The presenter quickly shows how changing one DAX measure can update the colors across multiple visuals simultaneously.
Step 1: Writing the Color Measure with SWITCH
The core idea is simple: we will create a DAX measure that, instead of returning a number or text like "On Target", returns a hex color code as a text string (e.g., "#D2222D" for red).
We can use the exact same logic we developed in the previous lesson with SWITCH(TRUE(), ...). We'll simply replace the text outputs with the hex codes for the colors we want.
Let's define our color logic based on the [Sales Variance (%)] measure:
- Exceeded Target (variance > 5%): Dark Green
- On Target (variance between 0% and 5%): Amber/Yellow
- Below Target (variance < 0%): Red
Here is the DAX measure that implements this logic. Notice how similar it is to the Performance Status measure you've already written.
Performance Color =
VAR SalesVariance = [Sales Variance (%)]
RETURN
    SWITCH(TRUE(),
        SalesVariance > 0.05, "#1A8827",  // Dark Green
        SalesVariance >= 0, "#FFBF00",    // Amber/Yellow
        "#D2222D"         // Red
    )
This pattern is extremely common in professional Power BI reports. The article below discusses this exact technique.
How to Add KPI Indicators to a Table in Power BI
This article discusses creating KPI indicators and has an excellent section on conditionally coloring them. The logic they use is identical to what we're implementing.
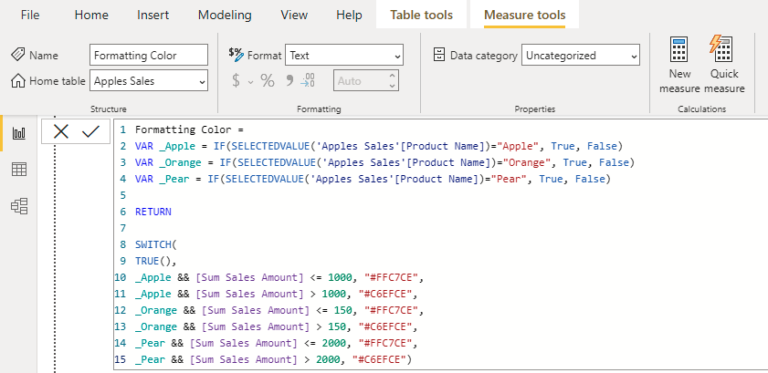
Read the section titled 'Conditionally Coloring your DAX Icons'. Pay close attention to the DAX measure Revenue MoM Icon Color. It uses the SWITCH(TRUE(), ...) pattern to return hex codes based on performance tiers, just like our Performance Color measure.
This image shows another example of a DAX measure using SWITCH to return different hex color codes based on various conditions. It's a versatile and powerful pattern.
Step 2: Applying the Measure to a Visual
Once you have your [Performance Color] measure, you need to tell Power BI to use it. You do this in the conditional formatting settings for a visual.
The following video and text will guide you through the process. The key is to select Field value as the format style.
Power BI Conditional formatting using Measures
Now, let's see how to apply our measure. This video segment provides a clear, step-by-step walkthrough of the user interface.
Watch the clip from 03:01 to 04:30. The presenter shows exactly where to go in the formatting pane, how to select 'Field value', and how to choose the DAX measure you created to drive the color.
Here are the steps written out for your reference:
- Select the visual you want to format (e.g., your matrix from the last lesson).
- Go to the Format your visual (paintbrush) pane.
- Expand the Cell elements section.
- In the dropdown, choose the column you want to format (e.g.,
Sales Variance (%)). - Turn on the Background color toggle and click the fx button next to it.
- The conditional formatting dialog will open.
- For Format style, select Field value.
- For What field should we base this on?, find and select your
[Performance Color]measure.
- Click OK.
Your visual will instantly update, with the background colors of the cells reflecting your DAX logic.

Your Turn: Apply Dynamic Coloring
Now it's time to apply this to your own report.
- Create the Measure: In your Power BI file, create the
Performance Colormeasure using theSWITCHformula provided above. - Format the Background: Go to your matrix visual. Following the steps in the previous section, apply the
[Performance Color]measure to the background color of your[Sales Variance (%)]values. - Format the Font (Optional Challenge): For extra clarity, you can also color the
Performance Statustext itself. In Cell elements, selectPerformance Statusfrom the dropdown, turn on Font color, and apply the same[Performance Color]measure to it.
Your matrix should now be much easier to interpret, with colors instantly drawing attention to months that are below, on, or exceeding their targets.
Conclusion
Fantastic work! You have now mastered one of the most impactful techniques for finalizing a Power BI report. By using DAX to drive conditional formatting, you can create dynamic, intuitive, and professional-looking dashboards that communicate insights far more effectively than a simple table of numbers.
Key Takeaways:
- DAX measures can return text values, including the hex codes that define colors.
- The
SWITCH(TRUE(), ...)pattern is the ideal way to implement multi-tiered conditional logic for colors, building directly on what you learned in the previous lesson. - The Field value option in the conditional formatting pane is the bridge that connects your DAX logic to the visual's appearance.
- This technique is highly maintainable; if you need to change your company's color for "good" performance, you only need to update the hex code in one measure.
Preview of the Next Lesson:
In our next lesson, we will continue finalizing our report by tackling another powerful feature: creating dynamic visual titles. You'll learn how to write a DAX measure that generates a title that automatically updates based on the filters or slicers a user has selected, providing essential context for anyone viewing your report.