Hello! Welcome to the second lesson in our module on "Advanced DAX: Dynamic Measures and Conditional Logic."
In our last lesson, you mastered the SELECTEDVALUE function, which is the key to making your reports "listen" to user input. You learned how to capture a single selection from a slicer and use it within a simple IF statement to conditionally show a calculation.
Today, we'll take that concept to the next level. We will build one of the most powerful and user-friendly features in a Power BI report: a dynamic measure, or "measure switcher." This will allow a user to select a metric from a slicer—like "Total Sales," "Total Quantity," or "Profit Margin"—and have a visual instantly update to display that metric. This technique is fundamental to creating clean, interactive, and professional-grade dashboards.
This lesson directly addresses the learning outcome: Create a dynamic measure that changes the calculation it performs based on a user's selection, using SWITCH and SELECTEDVALUE.
The Three-Part Pattern
Creating a measure switcher involves three core components working together. Understanding this pattern is key, as you will use it frequently.
- Base Measures: These are the individual calculations you want to switch between (e.g., a measure for total sales, another for total quantity).
- A Disconnected "Parameter" Table: This is a simple, standalone table that contains the names of your base measures as text. This table's only job is to populate a slicer, giving the user a list of options to choose from.
- The "Master" Dynamic Measure: This is the main DAX measure that uses
SELECTEDVALUEto read the user's choice from the slicer and aSWITCHfunction to return the result of the correct base measure.
To get a high-level overview of this process, let's start with a short reading.
How to Create a Dynamic Measure in Power BI | Graphed Blog
This article from the Graphed Blog, 'How to Create a Dynamic Measure in Power BI', lays out the exact process we'll be following today. It's a great roadmap for what we're about to build.
Read the sections 'What Are Dynamic Measures, Anyway?' and 'Step-by-Step: Creating a Dynamic Measure in Power BI'. This will give you a clear overview of the components we need: base measures, a parameter table, and a master 'SWITCH' measure.
Now, let's build this step-by-step in your Power BI file.
Step 1: Create Your Base Measures
First, we need the individual measures that will serve as our building blocks. You should already have [Total Sales] from our previous lessons. Let's create two more for this exercise: [Total Quantity] and [Profit Margin].
- Create a measure for Total Profit:
Total Profit = SUM(Sales[SalesAmount]) - SUM(Sales[TotalProductCost]) - Create a measure for Total Quantity:
Total Quantity = SUM(Sales[OrderQuantity]) - Create a measure for Profit Margin (as a percentage):
Important: After creating theProfit Margin = DIVIDE([Total Profit], [Total Sales])[Profit Margin]measure, select it in the Fields pane and use the Measure tools ribbon to format it as a Percentage. This will be important later.
Step 2: Create the Disconnected Parameter Table
Next, we need a table to provide the options for our slicer. Slicers work on table columns, so we can't add our measures to them directly. Instead, we create a table that holds the text names of our measures.
The cleanest way to do this is with a DAX expression. Go to the Modeling tab and click New Table.
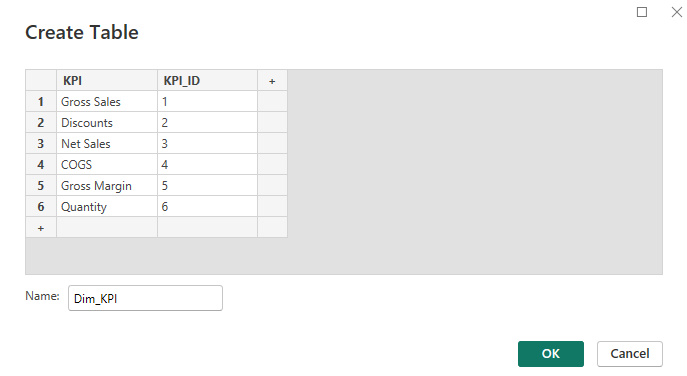
Enter the following DAX code to create the table:
Measure Selection =
DATATABLE(
    "Measure Name", STRING,
    "Sort Order", INTEGER,
    {
        { "Total Sales", 1 },
        { "Total Quantity", 2 },
        { "Profit Margin", 3 }
    }
)
Why the 'Sort Order' column? By default, Power BI sorts text alphabetically. This column gives us explicit control over the order in which the measures appear in our slicer. To apply it:
- Go to the Data View.
- Select the
Measure Selectiontable. - Click on the
Measure Namecolumn to select it. - In the Column tools ribbon, click Sort by column and choose
Sort Order.
The following video demonstrates creating this disconnected table.
The first step in building the user interface for our dynamic measure is to create a new, disconnected table. This video from Goodly provides a clear demonstration of how to do this using a simple DAX table constructor.
Watch from 01:55 to 03:48. The presenter explains why a table is needed for the slicer and shows you how to create one with the desired text values. Notice that this table is not related to any other tables in the model.
Step 3: Write the "Master" Dynamic Measure with SWITCH
This is where the magic happens. We'll write one measure that acts as a switchboard, directing Power BI to the correct base measure based on the user's slicer selection.
This master measure uses SELECTEDVALUE to read the slicer and the SWITCH function to evaluate the selection. SWITCH is a powerful and readable alternative to writing complex, nested IF statements. The common pattern is SWITCH(TRUE(), <condition1>, <result1>, <condition2>, <result2>, ...).
Watch how this is done in the next segment of the video.
Now we'll build the core of our solution. This involves two parts: capturing the slicer selection with SELECTEDVALUE, and then using a SWITCH function to return the correct base measure.
Watch from 03:48 to 06:49. First, you'll see how SELECTEDVALUE is used to capture the user's choice. Then, you'll see the main SWITCH function being built, which evaluates this choice and runs the corresponding measure. Pay close attention to how the text from the slicer table must exactly match the text in the SWITCH conditions.
Now, create this measure in your own file. Let's name it Selected Measure:
Selected Measure =
VAR SelectedMeasureName = SELECTEDVALUE('Measure Selection'[Measure Name], "Total Sales")
RETURN
    SWITCH(
        TRUE(),
        SelectedMeasureName = "Total Sales", [Total Sales],
        SelectedMeasureName = "Total Quantity", [Total Quantity],
        SelectedMeasureName = "Profit Margin", [Profit Margin],
        [Total Sales] // Default value if something goes wrong
    )
Let's break this down:
VAR SelectedMeasureName = SELECTEDVALUE(...): We capture the user's selection into a variable. We provide "Total Sales" as a default if nothing or multiple items are selected.RETURN SWITCH(TRUE(), ...): We use theSWITCH(TRUE())pattern to check multiple conditions.SelectedMeasureName = "Total Sales", [Total Sales]: If the selected value is the text "Total Sales", the formula returns our[Total Sales]measure. This is repeated for the other measures.
Step 4: Putting It All Together on the Report Canvas
With all the pieces built, it's time to build the interactive visual.
- Add a Slicer to your report page. Drag the
Measure Selection[Measure Name]field into it. - Add a visual, such as a Clustered column chart.
- On the chart's X-axis, add
Product[Category]. - On the chart's Y-axis, add your new
[Selected Measure].
That's it! Now click the buttons in your new slicer. You should see the chart instantly update to show Total Sales, then Total Quantity, then Profit Margin.
Advanced Topic: Handling Different Number Formats
You may have noticed a problem: when you select "Profit Margin", the chart shows values like 0.45 instead of 45%. This is because a single measure ([Selected Measure]) can only have one format type (e.g., General, Currency, or Percentage).
The solution is to use the FORMAT function. However, there's a critical catch: FORMAT converts your number into a text string. This means a formatted measure cannot be used on the axis of a bar or line chart, but it works perfectly in Card, Table, and Matrix visuals.

Let's create a second, formatted version of our dynamic measure specifically for use in a Card visual.
Selected Measure Formatted =
VAR SelectedMeasureName = SELECTEDVALUE('Measure Selection'[Measure Name], "Total Sales")
RETURN
    SWITCH(
        TRUE(),
        SelectedMeasureName = "Total Sales", FORMAT([Total Sales], "$#,##0"),
        SelectedMeasureName = "Total Quantity", FORMAT([Total Quantity], "#,##0"),
        SelectedMeasureName = "Profit Margin", FORMAT([Profit Margin], "0.0%"),
        FORMAT([Total Sales], "$#,##0") // Default
    )
Now, add a Card visual to your report and use this new [Selected Measure Formatted] as its field. As you click the slicer, you will see the card display a perfectly formatted value for each selection.
Conclusion
Congratulations! You have just implemented one of the most valuable patterns in Power BI development. By combining base measures, a disconnected table, SELECTEDVALUE, and SWITCH, you can create highly interactive and clean reports that empower users to explore data on their own terms.
Key Takeaways:
- Dynamic measures rely on a three-part pattern: base measures, a disconnected table for a slicer, and a master
SWITCHmeasure. - The
SWITCH(TRUE(), ...)pattern is a highly readable and efficient way to handle multiple conditional outcomes. SELECTEDVALUEis the bridge that connects the user's slicer selection to the logic in yourSWITCHfunction.- Handling different number formats (like currency and percentages) requires the
FORMATfunction, which converts the output to text and is best used in cards and tables.
Preview of the Next Lesson:
You've learned how to let users choose what they see. In our next lesson, we'll explore another powerful dynamic technique: filtering. You will learn to use the TOPN function to build reports that automatically show the "Top 10 Products by Sales" or the "Bottom 5 Regions by Profit," allowing users to focus on the most significant data points.