Hello! Welcome to our next lesson in the "Advanced DAX" module.
In our last session, we built a fantastic dynamic measure switcher using SELECTEDVALUE and SWITCH. You learned how to empower users by letting them choose what metric to analyze. Today, we'll continue this theme of creating insightful, dynamic reports by focusing on another common business question: "Who are our top performers?"
This lesson will teach you how to create a DAX measure that isolates and calculates values for only the top N items—for example, the total sales generated by your top 10 products. This is a crucial skill for focusing reports on the most significant contributors to your business's success.
By the end of this lesson, you will be able to: Write a Top N filtering measure using TOPN combined with CALCULATE to show top products by sales.
What is TOPN and Why Is It Different?
The star of today's lesson is the TOPN function. Before we write any code, it's essential to understand its fundamental nature. Unlike functions you've used before like SUM or AVERAGE that return a single value (a scalar), TOPN is a table function. It takes a table as input, sorts it based on an expression you provide, and returns a new table containing just the top 'N' rows.
This distinction is critical. Because TOPN returns a table, you cannot use it by itself as a measure in a visual.
To see this in action and understand how TOPN differs from a ranking function like RANKX, please watch the first part of the following video from Curbal.
DAX Fridays Battle #187: RANKX vs TOPN
This video, 'DAX Fridays Battle #187: RANKX vs TOPN', clearly explains the fundamental difference between RANKX (which returns a value) and TOPN (which returns a table). Understanding this is the first step to using TOPN correctly.
Watch from the beginning to 01:25. Focus on the core message: RANKX returns a single value for each row, while TOPN returns an entire table of results.
The Core Pattern: Combining TOPN with CALCULATE
So, if TOPN returns a table, how do we use it to create a measure? We use it as a filter inside the CALCULATE function. This is the central pattern you need to master:
CALCULATE( [Your Measure], TOPN(...) )
Here, TOPN generates a table of the top items, and CALCULATE uses that table to modify the filter context, ensuring that [Your Measure] is only evaluated for those top items.
Let's look at the syntax of TOPN.
The article 'Power BI DAX TOPN function' by Data Bear provides a clear breakdown of the function's syntax.
Read the section titled 'TOPN syntax'. Pay attention to the four main parameters: n_value, table, orderBy_expression, and the optional order.
In summary, the syntax is:TOPN(<n_value>, <table>, <orderBy_expression>, [<order>])
n_value: How many rows you want (e.g., 10 for the top 10).table: The table you want to rank.orderBy_expression: The measure or calculation to sort by (e.g.,[Total Sales]).order:ASC(ascending) for bottom N, orDESC(descending) for top N.

Practical Application: Building a Top 10 Sales Measure
Now, let's apply this theory. We will create a measure to calculate the sales amount for only our Top 10 products.
- Make sure you have your
[Total Sales]measure from previous lessons:Total Sales = SUM(Sales[SalesAmount]) - Now, create the new
TOPNmeasure:Top 10 Product Sales = CALCULATE( [Total Sales], TOPN( 10, VALUES('Product'[EnglishProductName]), [Total Sales], DESC ) )
Let's break down this measure:
CALCULATE([Total Sales], ...): We start by telling DAX we want to calculate[Total Sales], but in a modified filter context.TOPN(...): This function provides the filter.10: This is our 'N'—we want the top 10.VALUES('Product'[EnglishProductName]): This is a crucial part. We are not ranking the entireProducttable. Instead,VALUESprovides a distinct list of product names in the current filter context. This makes the measure dynamic. For example, if your report is filtered to the "Bikes" category,VALUESwill only provide a list of bikes to be ranked.[Total Sales]: This is the expression we're ranking the products by.DESC: We specify descending order to get the highest sales values at the top.
Test Your Measure
Create a new table visual in your report.
- Add
Product[EnglishProductName]to the rows. - Add
[Total Sales]as a column. - Add your new
[Top 10 Product Sales]as another column.
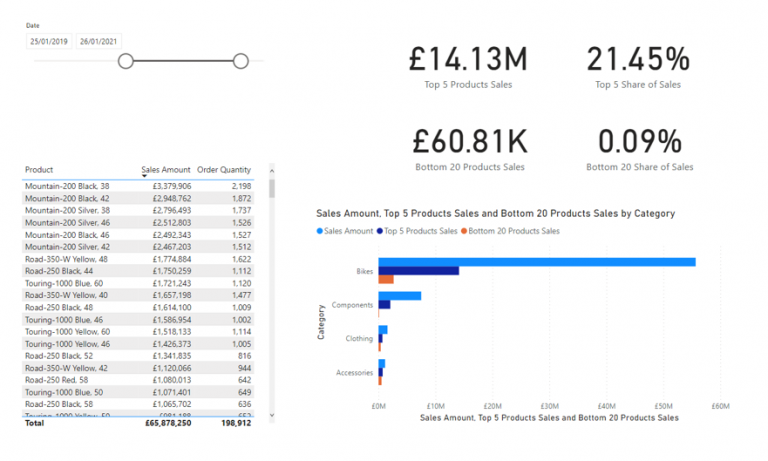
You will see that [Top 10 Product Sales] shows a value for the top 10 products and is (Blank) for all others. This is the pattern working correctly! The CALCULATE function evaluates the measure for each product in the visual; if a product isn't in the table returned by TOPN, the result is blank.
An Important Detail: Handling Ties
What happens if the 10th and 11th products have the exact same sales amount? By default, TOPN will return both, meaning you might get more than 10 results.
Watch this short video from SQLBI to understand this behavior and how to resolve it by adding a secondary, unique sort column to break ties.
The 'TOPN - DAX Guide' video quickly explains how ties are handled and how you can ensure you always get exactly the number of results you expect.
Watch from 00:57 to 02:04. Notice how adding a second sort expression (Product Name) breaks the tie and limits the result to the requested number of rows.
A more robust version of our measure to handle ties would look like this (adding the product name as a tie-breaker):
Top 10 Product Sales (with Tie-breaker) =
CALCULATE(
    [Total Sales],
    TOPN(
        10,
        VALUES('Product'[EnglishProductName]),
        [Total Sales], DESC,
        'Product'[EnglishProductName], ASC // Secondary sort to break ties
    )
)
Next Level: Making 'N' Dynamic
Just like in our last lesson, we can make this component interactive. Instead of hardcoding the number 10, you can let the user decide if they want to see the Top 3, Top 5, or Top 10.
The pattern is exactly the same as the one you learned for the measure switcher:
- Create a new disconnected table with a column of numbers (e.g., 3, 5, 10, 20).
- Add a slicer to your report based on this new table's column.
- Create a measure to capture the user's choice using
SELECTEDVALUE. - Replace the hardcoded
10in yourTOPNmeasure with theSELECTEDVALUEmeasure.
The "TOPN Dynamic function" section in the Data Bear article you looked at earlier walks through this exact process. I encourage you to try implementing this yourself as a challenge. It's an excellent way to solidify the skills from the last two lessons.
Conclusion
You have now added another powerful, context-aware tool to your DAX toolkit. You've learned how to isolate the top performers in your data, a request that comes up constantly in business analysis.
Key Takeaways:
TOPNis a table function that returns the top N rows of a table based on an expression.- The primary pattern for using
TOPNin a measure isCALCULATE( [Measure], TOPN(...) ), whereTOPNacts as a filter. - Using
VALUESinsideTOPNmakes your calculation dynamic and respectful of the existing filter context (slicers, other visuals). TOPNcan return more than N rows in case of ties; you can add a secondary sort key to break ties and ensure a fixed number of results.
Preview of the Next Lesson:
Your TOPN measure correctly returns BLANK for items not in the top set. While this is often desired, sometimes you need to handle these blanks differently—perhaps by showing a zero or grouping them into an "Other" category. In our next lesson, we will cover exactly that: how to handle blank or missing data gracefully in your measures using IF, ISBLANK, and COALESCE.