Welcome to the first lesson in our new module, "Advanced DAX: Dynamic Measures and Conditional Logic."
In the previous module, we focused on mastering powerful, but predefined, analytical calculations like rolling and running totals. You learned to manipulate the filter context with functions like ALL and DATESINPERIOD to look at your data across different time windows.
Now, we're going to shift our focus to making your reports more interactive. Instead of just presenting analysis, you will learn to build measures that respond directly to your users' actions. The first step on this journey is learning how to capture user input.
This lesson addresses the learning outcome: Write a measure using SELECTEDVALUE to capture a user's selection from a slicer. We'll explore what this function is, how it works, and how it serves as the foundation for creating dynamic and user-centric reports. Imagine a chart title that updates automatically based on a slicer, like the one below. SELECTEDVALUE is what makes this possible.
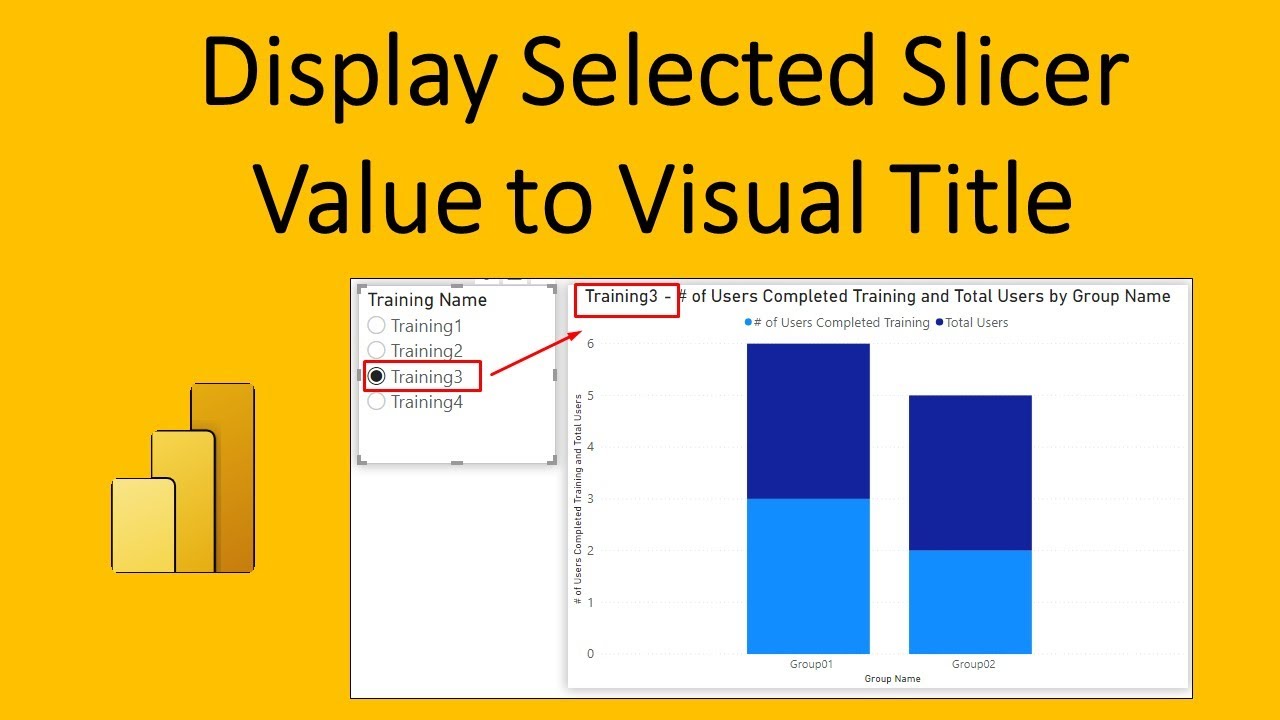
1. Understanding the SELECTEDVALUE Function
At its core, SELECTEDVALUE is a simple yet powerful function. Its purpose is to check if a single, unambiguous value has been selected for a given column in the current filter context.
- If one value is selected (e.g., a user clicks "Canada" in a country slicer), the function returns that value.
- If multiple values or no values are selected, it returns a blank or an optional default value that you can specify.
This function is essentially a more readable and convenient way of writing a common, older DAX pattern. To understand the theory behind it, please watch the following video from the experts at SQLBI.
This video from the 'SELECTEDVALUE - DAX Guide' series explains the function's purpose and how it simplifies a more complex DAX expression involving IF and HASONEVALUE.
Watch from the beginning to 00:32 to get the core definition. Then, watch from 02:17 to 02:52 to understand the older pattern that SELECTEDVALUE replaces. This aligns with your preference for knowing the 'why' behind functions.
As the video explains, the syntax for SELECTEDVALUE is:
SELECTEDVALUE ( <columnName>[, <alternateResult>] )
The <alternateResult> is optional, but it's a best practice to provide one to control what your visuals display when no single selection is made.
For a detailed text reference, you can consult the companion article from SQLBI.
Using the SELECTEDVALUE function in DAX - SQLBI
This article, 'Using the SELECTEDVALUE function in DAX', provides a written explanation of the function's syntax and behavior.
Read the sections 'SELECTEDVALUE syntax' and the bulleted list under 'It is important to remember that:'. This will solidify your understanding of how the function is translated by the DAX engine and its relationship with the filter context.
2. Capturing a Slicer Selection: A Practical Example
Now, let's move from theory to practice. You will create a measure to capture a user's selection from a slicer and display it on the report canvas.
Follow these steps in your Power BI project file:
-
Add a Slicer: Add a new slicer to your report page and drag the
Product[Category]field into it. -
Create the Measure: Create a new DAX measure with the following code. Here, we'll capture the selected category name, and if no single category is selected, we'll return the text "Multiple Categories".
Selected Category = SELECTEDVALUE( 'Product'[Category], "Multiple Categories" ) -
Display the Measure: Add a Card visual to your report and drag your new
[Selected Category]measure into it.
Now, interact with the slicer you created:
- With nothing selected: The card should display "Multiple Categories".
- Select "Bikes": The card should update to show "Bikes".
- Hold CTRL and select "Accessories": The card should revert to "Multiple Categories" because more than one value is now in the filter context.
The following resource provides a simple, visual walkthrough of this exact process. While you've already built it, reviewing this can reinforce the concept.
How To Use Power BI - Power BI DAX: SELECTEDVALUE
This article, 'Power BI DAX: SELECTEDVALUE', by Travers Data provides a very clear, step-by-step guide on creating and visualizing a SELECTEDVALUE measure.
Quickly read through the sections with the headers 'Let’s create a SELECTEDVALUE measure.' and the section immediately following it. Notice how the card visual reacts to selections in the slicer, table, and bar chart, demonstrating how filter context works.
3. Using the Captured Value to Control Calculations
Displaying the selected item is useful, but the real power comes from using that selection to drive other calculations. For example, you might want to show a detailed calculation only when a user has drilled down to a single item.
Let's see how to combine SELECTEDVALUE with an IF statement to achieve this. The video below provides an excellent demonstration.
How to use SELECTEDVALUE and HASONEVALUE in DAX // Beginners Guide to Power BI in 2021
This video, 'How to use SELECTEDVALUE and HASONEVALUE in DAX', demonstrates how to use the result of SELECTEDVALUE inside an IF statement to make a calculation dynamic.
Watch from 04:01 to 05:35. The host modifies a basic SELECTEDVALUE measure to conditionally perform a SUM of sales. Pay close attention to the NOT(ISBLANK(...)) pattern, which is a very common way to check if SELECTEDVALUE returned a value.
Let's apply this pattern to our data. Create a new measure that calculates [Total Sales] but only if a single Product Category is selected.
Sales for Selected Category =
-- This measure returns Total Sales only if one category is selected.
-- Otherwise, it returns BLANK().
VAR SelectedCategoryName = SELECTEDVALUE('Product'[Category])
RETURN
    IF(
        NOT ISBLANK(SelectedCategoryName),
        [Total Sales],
        BLANK()
    )
Add this new measure to a card visual. You will see that the card only shows a sales value when you select a single category in your slicer. In all other cases, it will be blank. This is an extremely common pattern for guiding users and preventing aggregation at levels that don't make business sense.
Conclusion
In this lesson, you've learned how to use SELECTEDVALUE to make your reports aware of user selections. This is the first and most critical step toward building truly interactive and dynamic dashboards.
Key Takeaways:
SELECTEDVALUEreturns a value from a column only when that column has a single, unambiguous value in the current filter context.- It's best practice to provide the optional alternate result to handle cases where zero or multiple items are selected.
SELECTEDVALUEis a modern, readable replacement for theIF(HASONEVALUE(...), VALUES(...))pattern.- The real power of
SELECTEDVALUEis unlocked when you use its output to control other functions, likeIForSWITCH, to create conditional calculations.
Preview of the Next Lesson:
We've now successfully used SELECTEDVALUE with a simple IF statement. In the next lesson, we will take this to the next level. You'll learn how to use it with the SWITCH function to create a "measure switcher"—a single, powerful measure that can perform several different calculations (e.g., show Total Sales, Total Profit, or Quantity) based on what the user chooses from a slicer.