Hello! Let's get started with our next lesson.
Introduction
In our last session, we dove into the theory behind CALCULATE, the most powerful function in DAX. You learned that its core job is to modify the filter context, either by adding new filters or, crucially, by overriding existing ones from your visuals. We established that in any conflict between a visual's filter and a CALCULATE filter on the same column, CALCULATE always wins.
Today, we move from theory to practice. You'll apply what you've learned to write your first CALCULATE measures. The goal for this lesson is to master using CALCULATE with a simple filter argument. This is one of the most common tasks for a data analyst. You'll frequently get business questions like, "What were our sales for just this one product category?" or "How much profit did we make from a specific customer segment?". CALCULATE is the key to answering them.
The Basic Syntax of CALCULATE
Before we write any DAX, let's review the syntax. The function is structured as follows:
CALCULATE(<expression>, <filter1>, <filter2>, ...)
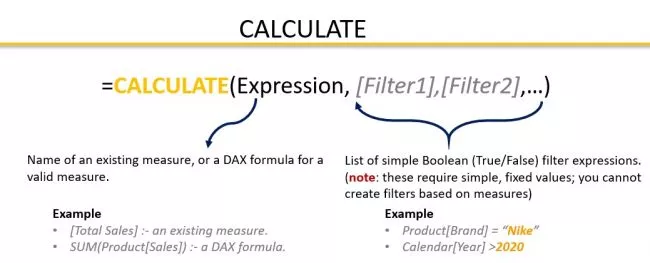
Let's break this down:
<expression>: This is the calculation you want to perform. It's almost always a pre-existing measure. For our case, we will use the[Total Revenue]measure you created in a previous module. This is a best practice as it makes your DAX code modular and easier to read.<filter>: This is a condition that alters the filter context. The simplest and most common type of filter is a boolean (true/false) expression that specifies a single value for a column. For example:'Product'[Category] = "Accessories".
You can add multiple filter arguments, and CALCULATE will apply all of them.
Your First CALCULATE Measure
Let's start by answering a direct business question: What was our total revenue from sales of 'Red' products?
To see how this is done professionally, we'll watch a short segment from the experts at SQLBI. They demonstrate this exact scenario.
This video, 'Introducing CALCULATE in DAX' by SQLBI, will show you precisely how to write a measure to filter for a specific product attribute.
Watch the clip from 01:38 to 03:19. Notice how they first identify the expression (Sales Amount) and then add the simple filter argument (Product color = Red).
As you saw in the video, the pattern is straightforward. Now, let's apply it to our own data model.
Your Task: Create a 'Red Product Revenue' Measure
-
In Power BI, make sure you are in the Report View.
-
In the Data pane, right-click on the
Salestable and select New measure. -
Enter the following DAX formula:
Red Product Revenue = CALCULATE( [Total Revenue], 'Product'[Color] = "Red" ) -
Format the new measure as a currency.
Verifying Your Measure
How do you know it worked? The best way is to test it in a visual.
- Create a Table visual on your report canvas.
- Add
Product[Color]to the table. - Add your base measure,
[Total Revenue], to the table. - Finally, add your new
[Red Product Revenue]measure.
You should see something like this:
| Color | Total Revenue | Red Product Revenue |
|---|---|---|
| Black | $X,XXX,XXX | (Blank) |
| Blue | $X,XXX,XXX | (Blank) |
| Red | $1,133,024 | $1,133,024 |
| Silver | $X,XXX,XXX | (Blank) |
| Total | $XX,XXX,XXX | $1,133,024 |
Notice two things:
- On the "Red" row,
[Total Revenue]and[Red Product Revenue]are the same. This is because the visual is already filtering for "Red", so yourCALCULATEmeasure doesn't need to do anything extra. - On all other rows,
[Red Product Revenue]is blank. This is because the visual's filter (e.g.,'Product'[Color] = "Black") conflicts with your measure's filter ('Product'[Color] = "Red"). As we learned,CALCULATE's filter wins, but since there are no sales that are both "Black" and "Red", the result is blank. - The total for
[Red Product Revenue]correctly shows the total revenue for only red products, ignoring the color filters from the table's rows.
This simple test confirms your CALCULATE measure is working exactly as intended. Here is another clear example of the same pattern applied to a different dataset.

Reinforcing the Concept with Multiple Filters
What if the business question is more specific? For example: What was the total revenue for 'Red' products sold in the 'United States'?
CALCULATE handles this easily. You simply add another filter argument. The function treats multiple filters as if they are joined by an "AND" operator.
Your new measure would look like this:
Red Product Revenue USA =
CALCULATE(
    [Total Revenue],
    'Product'[Color] = "Red",
    'Customer'[Country] = "United States"
)
DAX evaluates this by finding all sales that are for "Red" products AND were sold to customers in the "United States".
To see a demonstration of this, you can watch another short clip from the same SQLBI video.
Let's return to the SQLBI video to see how to add a second filter condition.
Watch from 05:55 to 07:05. This section shows how a second condition for the customer's country is added to the measure.
Conclusion
Congratulations! You've successfully moved from the theory of CALCULATE to its practical application. Writing a measure with a simple filter is a fundamental skill, and you've now built and verified one yourself.
Key Takeaways:
- The basic syntax for filtering is
CALCULATE(<expression>, 'Table'[Column] = "Value"). - It's best practice to use an existing measure as the first argument (the
<expression>). - You can add multiple simple filters to
CALCULATE, and they will be combined with "AND" logic. - Always test your new measures in a visual to confirm they are calculating correctly within different filter contexts.
Preview of the Next Lesson:
In this lesson, we used CALCULATE to add a filter and narrow our analysis to a specific slice of the data. But what if we need to do the opposite? A very common business need is to calculate percentages, like "what percentage of total revenue did this product category contribute?" To do this, we need a way to remove filters from the filter context. In the next lesson, you will learn how to use the ALL function inside CALCULATE to achieve exactly that.