Hello! Welcome to our next lesson in mastering DAX.
Introduction
In our last session, you learned how to use CALCULATE to add or overwrite the filter context, allowing you to answer specific questions like "What was our revenue for red products?" This is a powerful technique for narrowing your focus.
Today, we'll explore the other side of CALCULATE's power: its ability to remove filters. This is a crucial skill for any data analyst, as it's the foundation for one of the most common business calculations: percentages and ratios. The goal of this lesson is to use the ALL function within CALCULATE to remove filters from a table or specific columns. By the end, you'll understand how to create a measure that calculates a grand total, completely ignoring the filters applied by a visual.
The Business Problem: Calculating the "Whole"
Imagine a manager asks you: "For each product category, what percentage of our total revenue does it represent?"
This question is a simple ratio:
In DAX terms:
- The Part is the revenue for a specific category (e.g., "Bikes").
- The Whole is the grand total revenue across all categories.
Calculating the "Part" is easy. Your existing [Total Revenue] measure does this automatically inside a visual. If you place Product[Category] and [Total Revenue] in a table, the filter context in each row calculates the revenue for that specific category.
The challenge is the "Whole". How do you calculate the grand total revenue on a row that is already filtered for "Bikes"? This is where we need to tell DAX to ignore the filter context from the visual.
The Solution: CALCULATE with ALL
The ALL function is your tool for removing filters. It returns a table containing all rows or all unique values of a column, ignoring any filters that might have been applied. When used inside CALCULATE, it acts as a filter modifier.
There are two primary ways you will use ALL:
ALL(Table): Removes all filters from the specified table.ALL(Column): Removes filters from one or more specified columns, leaving other filters intact.
Let's explore both.
1. Using ALL(Table) to Get the Grand Total
The most common use of ALL is to clear all filters from your main fact table to get a "grand total".
Your Task: Create a Grand Total Revenue Measure
-
In Power BI, right-click on the
Salestable and select New measure. -
Enter the following DAX formula. This measure will calculate the
[Total Revenue]but first, it will remove all filters from theSalestable.Grand Total Revenue = CALCULATE( [Total Revenue], ALL(Sales) ) -
Format the new measure as a currency.
Verify Your Measure
Create a Table visual and add the following fields in order:
Product[Category][Total Revenue][Grand Total Revenue]
Your table should look something like this:
| Category | Total Revenue | Grand Total Revenue |
|---|---|---|
| Accessories | $110,683 | $27,497,222 |
| Bikes | $22,963,332 | $27,497,222 |
| Clothing | $1,330,736 | $27,497,222 |
| Components | $3,092,471 | $27,497,222 |
| Total | $27,497,222 | $27,497,222 |
Notice how [Grand Total Revenue] shows the same value on every single row. This is ALL in action! It has successfully ignored the filter context for Product[Category] coming from each row of the table.
2. Using ALL(Column) for More Specific Control
Sometimes you don't want to remove all filters. You might want to remove a filter from just one column. For example, to calculate a category's sales as a percentage of its parent super-category.
The logic is the same, but you specify a column instead of a whole table.
Your Task: Create a Measure for Total Revenue of All Colors
Let's create a measure that ignores the product color, but still respects other filters (like product category).
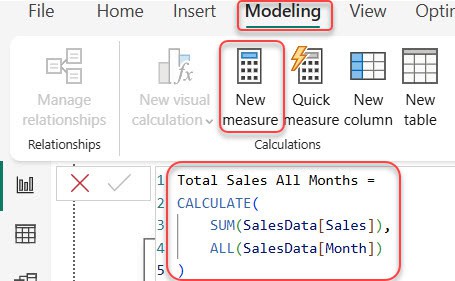
- Create a New measure in the
Salestable. - Enter this formula:
All-Color Revenue = CALCULATE( [Total Revenue], ALL('Product'[Color]) ) - Format it as currency.
Verify Your Measure
Create a new Table visual with these fields:
Product[Category]Product[Color][Total Revenue][All-Color Revenue]
Filter the table for the "Clothing" category. You'll see that [All-Color Revenue] shows the total revenue for all clothing, regardless of color, on each row. This demonstrates how ALL(Column) removes the filter from Product[Color] but respects the filter context for Product[Category].
Practical Walkthrough
Now, let's watch a video that puts these concepts into a real-world business scenario. The presenter wants to calculate the percentage of sales for each customer, which requires creating a denominator using ALL.
How To Use The ALL Function In Power BI And DAX [2022 Update]
In this video, 'How To Use The ALL Function In Power BI And DAX' from Enterprise DNA, you'll see how ALL is used to solve a common problem.
Watch from 00:55 to 04:20. Pay close attention to: The business problem he defines (calculating % of sales per customer). How he uses ALL(column) to create the denominator. The critical difference he explains between using ALL on a column versus an entire table.
Diving Deeper with Official Documentation
For a comprehensive understanding and to see more examples, the official Microsoft documentation is an excellent resource.
ALL function (DAX) - DAX | Microsoft Learn
Please read the following sections from the official Microsoft Learn documentation for the ALL function.
Start by reading the initial 'Syntax' and 'Remarks' sections. Then, carefully review the table under 'Remarks' that describes the different uses of ALL and ALLEXCEPT. Finally, read through 'Example 1', 'Example 2', and 'Example 3' to see how these patterns are applied to solve different ratio calculations.
This documentation solidifies the distinction between ALL(Table) for grand total ratios and ALL(Column) for subgroup ratios.
Conclusion
You have now learned one of the most fundamental patterns in DAX. By combining CALCULATE and ALL, you can escape the current filter context to create denominators for percentage calculations.
Key Takeaways:
ALLis a function that returns a table with filters removed.- Used inside
CALCULATE,ALLmodifies the filter context for a calculation. CALCULATE([Measure], ALL(FactTable))is the standard pattern for calculating a grand total.CALCULATE([Measure], ALL(Dimension[Column]))is used to remove a specific filter while keeping others.
Preview of the Next Lesson:
We've done the hard part—creating the "Whole" or the denominator. In the next lesson, we will put all the pieces together. You will use the DIVIDE function to combine your base measure (the "Part") with the ALL-based measures you created today (the "Whole") to calculate the final percentage of a grand total.