Hello! Welcome back to our course on mastering DAX.
In our first lesson, we established the end-to-end data analyst workflow, which serves as our roadmap. We learned that every successful data project begins not with data, but with a clear business problem.
Today, we'll dive into that crucial first step. Before we can define a problem, we need to understand what kinds of questions data analysis can realistically answer. This lesson is all about learning to identify common business questions in sales and operations. By the end, you'll have a mental toolbox of questions that drive the work of professional data analysts.
Why Business Questions Must Come First
In data analytics, it's tempting to jump straight into the data and see what you can find. However, this approach often leads to unfocused, irrelevant, or unusable results. The most effective analysts start by understanding the business need and then use data to address it. The business question dictates the data you need, the analysis you perform, and the story you tell.
To explore this idea further, let's watch a short video from David Langer, a data analytics professional. He makes a compelling case for why business questions are the true starting point.
Business Questions Before Data Analytics
This video, titled 'Business Questions Before Data Analytics', emphasizes the importance of starting with a well-defined question. The speaker categorizes business questions into a few key types, which provides a useful framework for thinking like an analyst.
Please watch the following segments: The introduction from 00:00 to 01:12, where the main argument is presented. The section on trend analysis from 01:12 to 02:28. The section on measuring impact from 02:58 to 03:59. Focus on his central message: the business question is more important than the analytical technique.
As the video highlights, most business questions fall into a few broad categories:
- Descriptive (What happened?): These questions focus on understanding historical performance and trends. Example: How did our sales change over the last year?
- Diagnostic (Why did it happen?): These dig deeper to find the root cause of a trend or event. Example: Why did sales dip in the third quarter?
- Predictive (What will happen?): These use historical data to forecast future outcomes. Example: What are our projected sales for the next six months?
- Prescriptive (What should we do?): These go a step further to recommend actions to achieve a desired outcome. Example: Which marketing strategy should we implement to increase sales by 10%?
For our work in Power BI, we will primarily focus on answering descriptive and diagnostic questions.
A Case Study: Answering a Sales Manager's Questions
Let's make this more concrete with a practical example. Imagine you're a Business Intelligence Analyst for a toy company. A regional sales manager needs a dashboard to understand their region's performance. What questions would they have?
The following video from Maven Analytics walks through exactly this scenario. It's a perfect illustration of how a business need translates into specific, answerable questions.
Telling a Story with Data | Dashboard Build Demo
In this video, 'Telling a Story with Data', the presenter takes on the role of an analyst for 'Maven Toys'. Pay close attention to how they deconstruct the project brief to identify the audience, their goals, and the specific questions that need answers.
Watch the segment from 02:55 to 06:18. Focus on how the general assignment ('design an explanatory dashboard') is broken down into concrete business questions that will drive the dashboard's design.
From the video, we can extract several key business questions the sales managers needed answers to:
- How is revenue trending? Is it increasing or decreasing?
- Which products are driving these trends (i.e., what's performing best or worst)?
- Are we losing potential revenue because products are out of stock?
- How does our performance this month or year compare to previous periods (Month-over-Month, Year-over-Year)?
Notice how these questions are specific, measurable, and directly tied to the manager's goals of increasing revenue and minimizing loss. This is the level of clarity we should aim for.
Common Questions in Sales & Operations
Your background in logistics and supply chain gives you a great advantage, as you're already familiar with the operational side of a business. Let's explore some common questions from both sales and operations, which often overlap.
Sales Questions
Sales teams are fundamentally driven by revenue and customer acquisition. Their questions often revolve around performance, efficiency, and growth.
Sales Operations 101: Examples, Metrics, Roles & More
This article, 'Sales Operations 101', provides a great overview of the responsibilities and metrics that a sales operations team focuses on. The KPIs they track are a direct source for the business questions we can answer with data.
Please read the section titled 'What KPIs Should a Sales Operations Manager Track?'. For each of the 8 KPIs listed, try to formulate a business question that it would help answer. For example, for 'Average Deal Size', the question could be 'What is the average value of the deals we are closing?'.
Based on that reading and other common scenarios, here are some typical sales-focused questions:
- Performance:
- What is our total sales revenue for the period?
- Which products or product categories are the most profitable?
- Who are our top-performing sales representatives?
- Which regions or stores are generating the most sales?
- Efficiency:
- What is our average sales cycle length? (How long does it take to close a deal?)
- What is our lead-to-customer conversion rate?
- How accurate have our sales forecasts been?
- Customer Insights:
- Who are our top customers by revenue?
- What is the average lifetime value of a customer?
Operations and Supply Chain Questions
Your experience in logistics will resonate here. Operations teams are focused on efficiency, cost reduction, and ensuring the smooth delivery of goods and services.
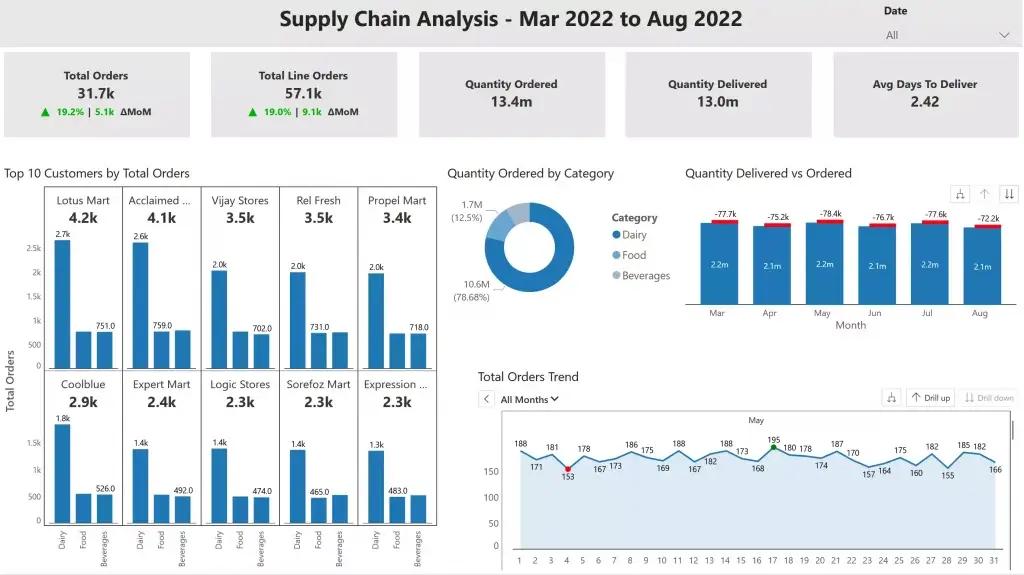
Let's look at some of the questions a dashboard like this helps answer.
Top 11 Supply Chain KPIs – Guide for 2026
The article 'Top 11 Supply Chain KPIs' is highly relevant to your background. It breaks down key metrics for monitoring the health and efficiency of a supply chain.
Please read the sections on 'Delivery performance KPIs', 'Inventory-centric supply chain KPIs', and 'Lead time KPIs'. As you read, think about how these metrics could have been useful in your previous roles in logistics and supply chain.
Drawing from the article, common operations questions include:
- Delivery & Fulfillment:
- What is our On-Time, In-Full (OTIF) delivery percentage? (Are customers getting the right products at the right time?)
- What is our Perfect Order Rate? (How many orders are processed without any issues like damage, delays, or errors?)
- What is our customer order cycle time? (How long does it take from order placement to delivery?)
- Inventory Management:
- What is our inventory turnover rate? (How quickly are we selling our inventory?)
- How many days of supply do we have for key products? (Are we at risk of a stockout?)
- Which products are slow-moving and taking up valuable warehouse space?
- Supplier Performance:
- Which of our suppliers have the best on-time delivery record?
- What is the defect rate for materials received from different suppliers?
Tying It All Together
Identifying these business questions is the starting point of the entire data analysis process. It ensures that the final dashboard or report is not just a collection of charts, but a tool that empowers decision-makers.
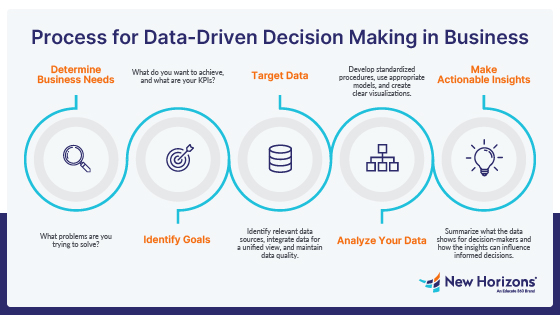
Conclusion
In this lesson, we moved from the abstract concept of a "business problem" to a concrete list of questions that data analysts answer every day.
Key Takeaways:
- All data analysis should begin with a clear business question.
- Business questions can be categorized (e.g., descriptive, diagnostic) and are often related to either Sales (revenue, growth) or Operations (efficiency, cost).
- Formulating precise questions helps define the Key Performance Indicators (KPIs) you need to measure.
- Your background in supply chain is a strong asset, as you're already familiar with the context behind many critical operational questions.
Preview of Next Lesson:
We've explored the types of questions analysts ask. In our next lesson, we'll build on this by learning how to define Key Performance Indicators (KPIs). We'll select the specific metrics we'll use to measure success for our course project, bringing us one step closer to formulating our final business problem statement.