Welcome to the first lesson of your personalized DAX course!
I'm excited to start this journey with you. Based on your goal to learn DAX within the context of a professional data analyst's role, we're going to begin not with code, but with a crucial first step: understanding the "big picture."
This lesson covers the entire data analysis workflow, from defining a business problem to delivering a final visualization. Mastering this process is what separates a good analyst from a great one. It provides the "why" behind every piece of DAX code we'll write in the upcoming lessons.
The Analyst's Journey: From Raw Data to Actionable Insight
Many people think data analysis is just about creating charts in Power BI. However, the visual dashboard is merely the tip of the iceberg. The real work—the structured process that ensures the final result is meaningful and impactful—happens below the surface.
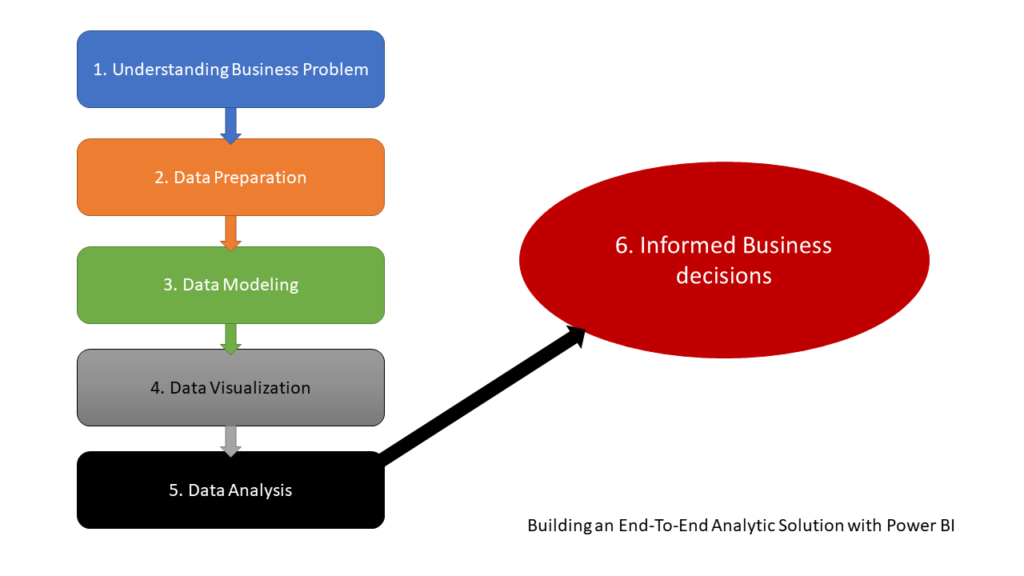
This process, often called the data analyst workflow, is a systematic approach to solving business problems using data. While the specific steps can be named differently, they generally follow a consistent path.
Let's look at a clear, high-level overview of this workflow, which we'll be following throughout this course.
To get a dynamic and engaging overview of this process, let's start with a short video from Maven Analytics. It provides an excellent framework for how to "think like an analyst."
How to Think Like a Data Analyst | Step-by-Step Guide
This video, 'How to Think Like a Data Analyst', outlines a clear, step-by-step framework for transforming raw data into action. Pay close attention to the six stages they present, as they form the foundation of our entire course.
Watch the entire video (it's about 6 minutes). As you watch, notice how the process starts with business-centric questions long before any data is even touched.
Now, let's break down these stages in more detail, connecting them to the work we'll be doing in Power BI.
Stage 1: Understanding the Business Problem
Every data project must begin with a clear question or problem. Without this, your analysis will lack direction and purpose. Given your background in management and supply chain, you've likely seen firsthand that the most successful projects are those with clearly defined objectives from the start.
This initial phase involves:
- Identifying the core business question: What are we trying to achieve or understand? Are we trying to increase sales, reduce costs, or improve customer satisfaction?
- Defining stakeholders: Who needs this information? A regional sales manager will need different insights than a CEO.
- Establishing success metrics (KPIs): How will we measure success? This involves defining Key Performance Indicators (KPIs) like Total Revenue, Profit Margin, or Year-over-Year Growth.
To go deeper into this critical first step, please read the introductory sections of the following guide. It's written specifically in the context of a Power BI project.
END-TO-END ANALYTICS WITH MICROSOFT POWER BI
The guide 'END-TO-END ANALYTICS WITH MICROSOFT POWER BI' by Nikola Ilic provides a practical look at this workflow. The first few sections will reinforce the importance of starting with the business problem.
Please read the sections 'Introduction' and 'Understanding Business Problem' (approximately pages 4-12). Focus on the examples of business questions and the author's argument for why this step is non-negotiable.
Stage 2: Data Collection and Preparation
Once you know what you want to answer, you need to gather and prepare the necessary data. This is often the most time-consuming part of the process, taking up to 70-90% of an analyst's time. The principle here is simple: "garbage in, garbage out." High-quality analysis depends on high-quality data.
This stage involves several key activities:
- Data Sourcing: Identifying and connecting to the data you need. This could be internal data (like sales transactions from a database) or external data (like public demographic information).
- Data Profiling: Examining the data to understand its structure, quality, and content. Are there missing values? Outliers? Inconsistencies?
- Data Cleaning & Transformation: This is the "scrubbing" process. It includes handling errors, removing duplicates, correcting typos, and structuring the data for analysis. In Power BI, this work is primarily done in the Power Query Editor.
We will cover data import and transformation in our next module, but it's essential to understand its place in the overall workflow.
Stage 3: Data Modeling and Analysis
With clean data, you can now structure it for analysis and begin searching for insights.
-
Data Modeling: This involves organizing your data tables into a logical structure that is efficient and accurate for analysis. The gold standard in Power BI is the Star Schema, where you have a central "fact table" (e.g., Sales) connected to descriptive "dimension tables" (e.g., Products, Customers, Dates). We will dedicate our entire next module to building a proper data model, as it is the bedrock of effective DAX.
-
Analysis: This is where you start "slicing and dicing" the data to find patterns, trends, and correlations. You'll formulate hypotheses and test them against the data. This is the stage where your DAX skills will truly shine, as you'll write measures to calculate the KPIs and business metrics you need to answer your core questions.
Stage 4: Data Visualization and Communication
An insight is only valuable if it can be clearly communicated to those who need to act on it. This stage is about telling a compelling story with your data.
It involves:
- Choosing the right visuals: A line chart is great for showing trends over time, while a bar chart is better for comparisons.
- Designing effective dashboards: Your report should be intuitive, uncluttered, and guide the user to the most important information. Key metrics should be prominent.
- Crafting a narrative: Your presentation should walk stakeholders through the original problem, your analytical approach, your key findings, and your final recommendations.
As the Maven Analytics video highlighted, don't let a brilliant analysis fail due to poor communication.
Stage 5: Driving Action and Making Decisions
The final step is to translate your findings into actionable recommendations. Your goal as an analyst isn't just to present data; it's to drive change.
This means:
- Making clear, data-driven recommendations.
- Answering the "So what?" question for your stakeholders.
- Sometimes, even quantifying the potential impact of your proposed actions (e.g., "Implementing this change could increase sales by an estimated 5%").
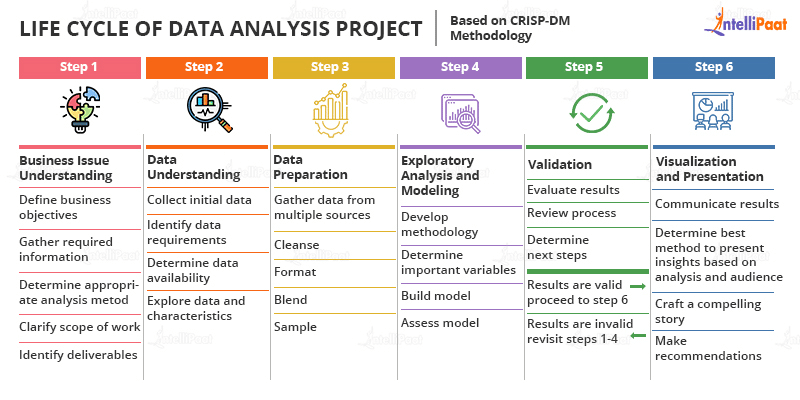
An Alternative View
There are many named frameworks for this process. Another common one is based on the CRISP-DM methodology, which provides a slightly more detailed breakdown.
How This Workflow Shapes Our Course
Your request to learn within a professional framework was spot-on. Here is how our course syllabus maps directly to the workflow we've just discussed:
- Module 1 (Today's Lesson):
Stage 1: Business Problem Definition - Module 2 (Data Modeling):
Stage 2 & 3: Data Preparation & Modeling - Modules 3-10 (DAX Fundamentals to Advanced):
Stage 3: Analysis(We'll be building the analytical engine of our report) - Modules 11-12 (Practical Application & Optimization):
Stage 4 & 5: Visualization & Action(We'll use DAX to create dynamic visuals, targets, and deliver final insights)
By following this structure, you're not just learning functions; you're learning how to be a data analyst.
Conclusion
In this lesson, we established the foundational framework for our entire course.
Key Takeaways:
- Data analysis is a structured, end-to-end process that goes far beyond just creating charts.
- The workflow always starts with a clear business problem and ends with actionable recommendations.
- The main stages are: Understanding the Problem, Data Preparation, Data Modeling & Analysis, Visualization & Communication, and Driving Action.
- This workflow provides the context and purpose for every DAX measure we will write.
Preview of Next Lesson:
Now that we have our roadmap, our next step is to begin the journey. In the next lesson, we will focus on the second learning outcome of this module: identifying common business questions in sales and operations that data analysis can answer. We will start defining the specific business problem for our course project.