Hello! Welcome back to our course on mastering DAX.
In the last lesson, we explored how successful data analysis starts with asking good business questions. We looked at common questions related to sales and operations, leveraging your own background in supply chain.
Today, we take the next logical step: learning how to answer those questions with specific, measurable data points. This lesson is dedicated to defining Key Performance Indicators (KPIs). KPIs are the bridge between a general business question and a concrete calculation you'll perform with DAX.
By the end of this lesson, you will be able to define core KPIs relevant to a sales dataset, such as Total Revenue and Profit Margin, which will be fundamental to our project.
From Questions to Quantifiable Metrics
A business question like "Are our sales growing?" is a great starting point, but it's not precise enough for data analysis. We need to translate it into something we can measure. This is where KPIs come in.
What is a KPI, Really?
You've likely heard the terms "metric" and "KPI" used interchangeably, but there's a crucial distinction. Let's start with a clear definition.
What are KPIs and Metrics? | Data Fundamental for Beginners
This video from Alex The Analyst, titled 'What are KPIs and Metrics?', provides a clear and concise explanation of the difference between these two concepts. Understanding this is the first step to choosing impactful measures.
Please watch from the beginning until 02:47. Focus on: The definition of a metric. The definition of a KPI and how it relates to a metric. The diagram explaining that all KPIs are metrics, but not all metrics are KPIs.
As the video explains, the key takeaway is:
- A metric is any form of measurement (e.g., number of website visits, units sold).
- A KPI (Key Performance Indicator) is a specific metric that is chosen to measure progress towards a critical business goal.
For example, Total Units Sold is a metric. If the company's primary goal for the quarter is to "Increase market share by selling more units than last quarter," then Total Units Sold becomes a KPI for that goal.
Defining Good KPIs: The SMART Framework
Choosing a metric and calling it a KPI isn't enough. A good KPI must be well-defined and directly linked to a business objective. The most widely used method for this is the SMART framework.
The Data Analyst's Guide to Mastering Business Metrics & KPIs
This article, 'The Data Analyst's Guide to Mastering Business Metrics & KPIs', offers a practical blueprint for data analysts. We'll focus on its explanation of the SMART framework.
Please read the section titled 'The Senior Analyst’s Blueprint: Designing & Leveraging Impactful KPIs', focusing specifically on point #3, 'Define Metrics as SMART (And Operationalize Them)'. Pay attention to the meaning of each letter and the concept of an 'Operational Definition'.
A well-defined KPI should have all five SMART characteristics:

Let's break this down with an example:
- Bad KPI: "Track Sales"
- SMART KPI: "Increase total sales revenue by 5% in Q3 compared to Q2."
- Specific: It targets "total sales revenue."
- Measurable: The increase can be quantified as "5%."
- Achievable: A 5% goal is likely realistic (as opposed to 500%).
- Relevant: Increasing revenue is almost always relevant to business health.
- Time-bound: The timeframe is clearly defined as "in Q3."
The article also mentioned an operational definition. This is critical for you as a data analyst. It means documenting exactly how the KPI is calculated (e.g., Total Revenue = SUM(Sales[LineTotal])). This ensures everyone in the organization measures the same thing, the same way.
Core KPIs for Our Sales Analysis Project
Now, let's get practical and define the specific KPIs we'll use for our course project. We're analyzing a sales dataset, so our KPIs will naturally focus on financial performance.
The 4 Best Financial KPIs Every Company Should Be Measuring
In this video, 'The 4 Best Financial KPIs Every Company Should Be Measuring', expert Bernard Marr discusses the most important financial metrics. We'll focus on the first two, which are the bedrock of any sales analysis.
Please watch from 00:27 to 01:58. Listen closely to his definitions of sales/revenue and profitability.
Based on the video and standard business practice, we will start by defining three primary KPIs for our project:
-
Total Revenue (or Total Sales)
- Business Question: How much money are we generating from sales?
- Operational Definition: The sum of the sale price multiplied by the quantity for every item sold, before returns or credits are accounted for. In our dataset, this will be the sum of the
Line Totalcolumn. - DAX Preview:
Total Revenue = SUM(Sales[LineTotal])
-
Total Profit
- Business Question: How much money is the business actually making after accounting for the cost of goods sold?
- Operational Definition: The sum of
Total Revenueminus the sum of theTotal Product Costfor all items sold. - DAX Preview:
Total Profit = SUM(Sales[LineTotal]) - SUM(Sales[TotalProductCost])
-
Profit Margin
- Business Question: How profitable are we? For every dollar of revenue, how much do we keep as profit?
- Operational Definition: The
Total Profitdivided by theTotal Revenue, expressed as a percentage. - DAX Preview:
Profit Margin = DIVIDE( [Total Profit], [Total Revenue] )
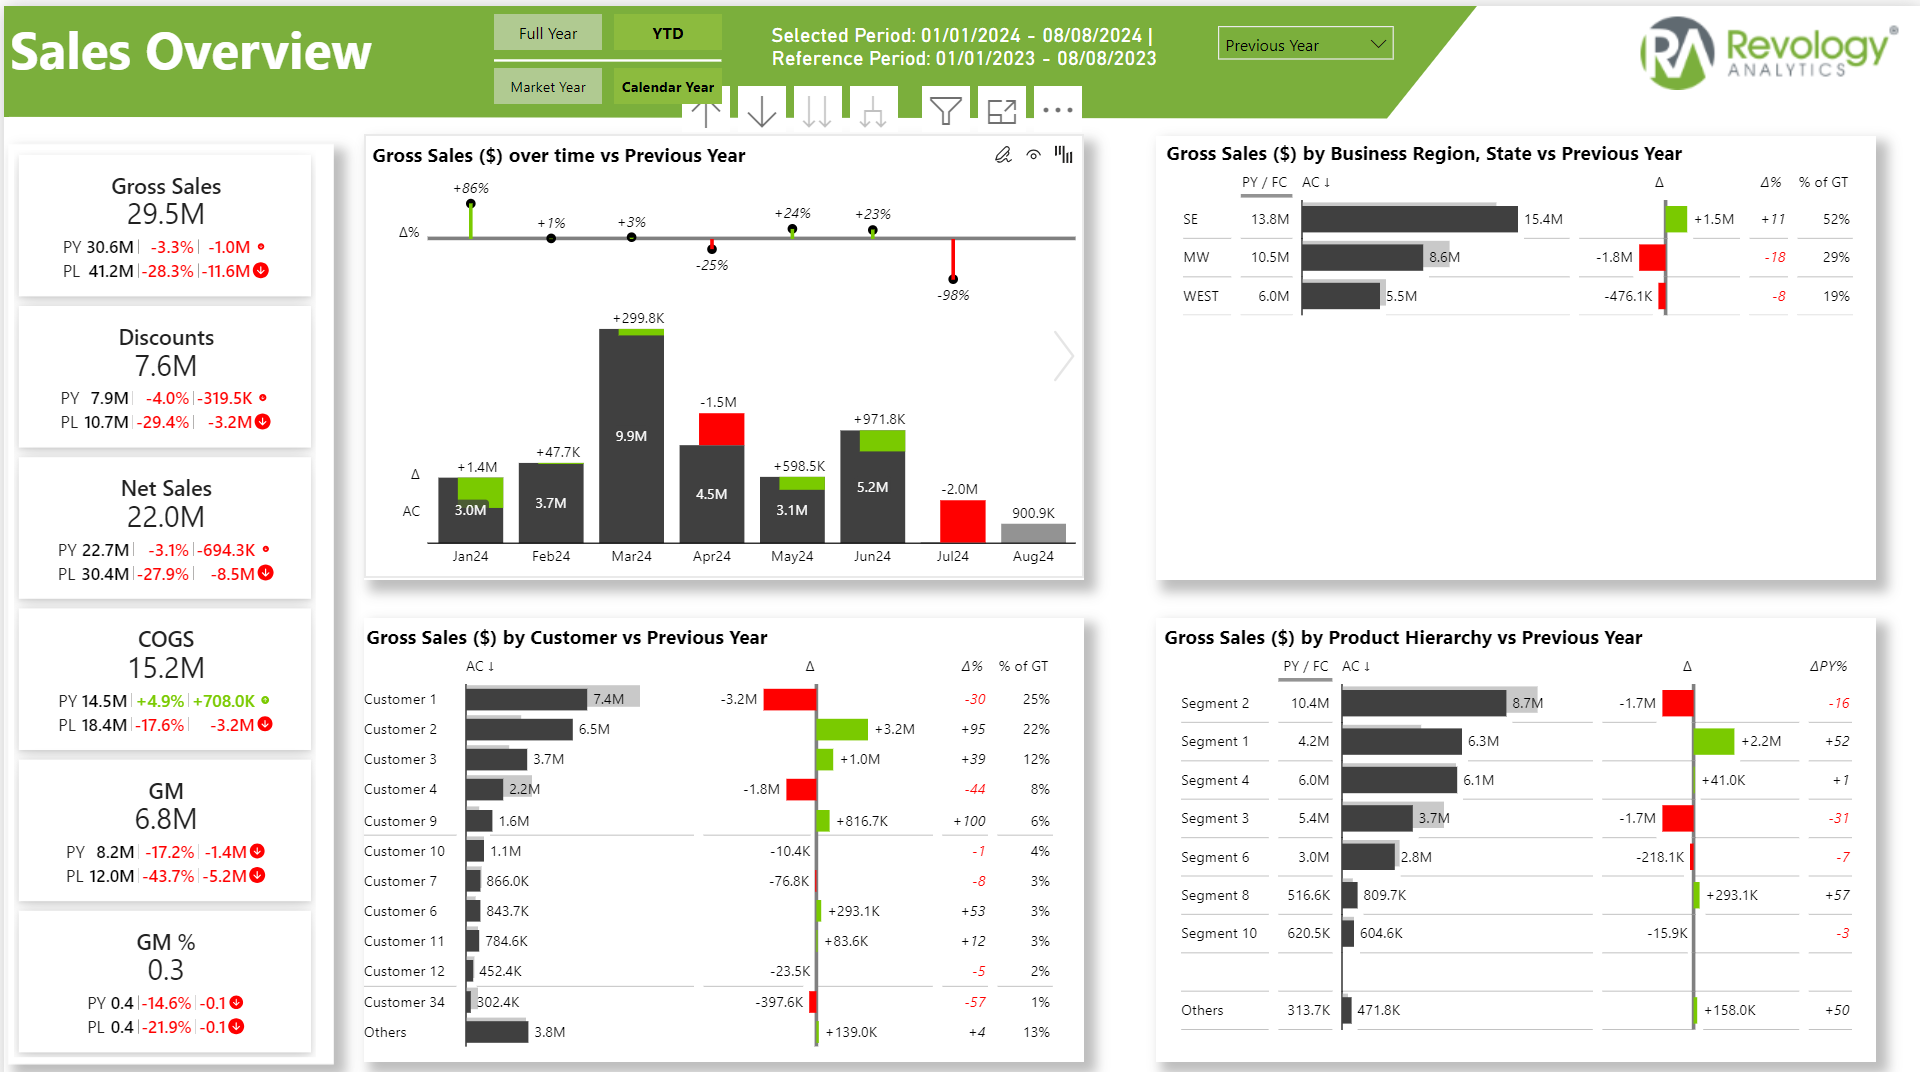
These KPIs are exactly what you see in professional dashboards. Notice how they appear prominently in this example sales overview.
Other Important Sales KPIs
While we'll start with the three KPIs above, a sales analysis can go much deeper. The following document from Microsoft lists a wide variety of KPIs that can be built in Power BI.
Sales KPIs and measures (Power BI) - Business Central
This Microsoft documentation, 'Sales KPIs and measures (Power BI)', is a great reference for the types of calculations that are common in a sales context. You don't need to memorize it, but skimming it will give you a feel for what's possible.
Briefly skim the KPIs listed under the 'Customer Table' and 'Documents Table' sections. Just notice the kinds of things analysts measure, like 'No. of New Customers', 'Total Sales (Amount)', and 'Return Rate'.
This shows that as we progress, we can answer more complex questions by creating KPIs for customer behavior (new vs. returning customers), product returns, and much more.
Conclusion
This lesson established the crucial link between business questions and measurable analysis. By defining clear, SMART KPIs, you transform a vague business goal into a specific analytical target.
Key Takeaways:
- A KPI is a specific metric chosen to track progress toward a key business goal.
- The SMART framework (Specific, Measurable, Achievable, Relevant, Time-bound) is essential for creating effective KPIs.
- An operational definition ensures that everyone calculates a KPI the same way.
- For our project, we have defined our starting KPIs: Total Revenue, Total Profit, and Profit Margin.
Preview of Next Lesson:
We have our business questions and our KPIs. The final step in setting up our project is to combine them into a formal guiding document. In the next lesson, you will formulate a clear business problem statement that will define the scope and purpose of the dashboard we'll build throughout this course.