Hello. The previous lesson showed what a vividness questionnaire can record—and why a score still depends on a person’s description of their experience. This lesson takes a different approach: researchers ask whether attempting to imagine a pattern changes what someone subsequently reports seeing. You will trace a binocular-rivalry experiment, interpret its group results, and examine why its response-bias controls are useful without being conclusive.
Turning an imagined pattern into a testable prediction
In binocular rivalry, a different image is presented to each eye at the same time. Rather than consistently seeing both images combined, an observer may perceive one as dominant. In imagery experiments, the competing images are often distinct striped patterns—for example, red horizontal stripes and green vertical stripes.
The key manipulation happens before the rivalry display. A participant is cued to imagine one pattern. After the imagery period, the experiment briefly presents the competing patterns and asks which appeared dominant. If imagining green makes a green response more likely than imagining red does, the imagined content has primed the later response.
Watch Joel Pearson’s explanation of the illusion and the brief-presentation procedure. Focus on the distinction between the pattern a participant is asked to imagine and the pattern they report seeing afterward.
Measuring Aphantasia and its Impact with Prof Joel Pearson
In “Measuring Aphantasia and its Impact,” from Aphantasia Network, Joel Pearson explains how binocular rivalry can be used to study imagery without asking participants to rate the vividness of a mental picture.
Watch the illusion for what happens when the two eyes receive competing images. Continue through the imagery task for the cue, brief rivalry display, and reported percept. Stop when the explanation turns to further uses of the measure.

The design tests a probability, not whether anyone sees their imagined pattern every time. With two balanced, decisive response options and equally frequent red and green imagery cues, about 50% of responses would match the cue if the cue had no effect. A higher proportion of matches is called imagery priming. “Chance” here is a property of this balanced task, not a claim that seeing during rivalry is random in every respect.
Reading the result without overreading it
A 2018 study by Keogh and Pearson used red and green striped patterns, a six-second imagery period, and a brief rivalry display. Participants reported the colour they saw. The researchers also included occasional mock rivalry trials and adjusted the patterns’ contrast to account for an observer’s tendency to see one eye’s input more readily. The selected passages below provide the procedure and the main comparison; the paper is a PDF, so its figure captions are useful landmarks.
The blind mind: No sensory visual imagery in aphantasia
Read the procedure and results in Keogh and Pearson’s study to connect the experimental design with the conclusion the authors draw.
On printed p. 55, start with the Fig. 1 caption beside Section 1.2, “Stimuli.” Read the trial timeline. Still in Section 1.2, read the mock-trial description, ending just before Section 1.3, “Experimental procedure.” In the Results discussion of Fig. 2E and F (around pp. 56–57), read the group comparison. Then, following the Fig. 2 caption on p. 57, read the eye-dominance check. Focus on which finding concerns imagery priming and which checks an alternative explanation.
The study found lower average imagery priming in its aphantasia group than in its general-population sample. The aphantasia group’s average was not statistically distinguishable from 50% in this test; the general-population sample’s average was above 50%. That is evidence about how the groups performed on this task. “Not statistically distinguishable from chance” does not establish that every member of the aphantasia group had exactly zero imagery, nor that no form of imagery could exist without affecting rivalry.
The eye-dominance adjustment addresses a different problem. Suppose the green pattern is easier for someone to see regardless of the imagery cue. That could distort a priming score. Adjusting stimulus contrast to balance the patterns helps make the cue comparison more informative. It does not settle whether a participant’s final answer perfectly reflects what they perceived.
This is also different from the VVIQ you studied previously. A VVIQ response describes the experienced vividness of voluntary imagery. A rivalry priming score describes an effect associated with an imagery instruction on a later response. The two measures can inform one another without being interchangeable.
What a mock trial controls—and what it cannot
The crucial caution is that the rivalry outcome is still reported by the participant. Someone might be more willing to say “green” after being told to imagine green, even if their perception did not change. This is response bias—also called decisional bias in the paper.
To look for it, researchers inserted mock rivalry displays: physically composed displays containing red and green regions, made to resemble some features of a mixed rivalry percept rather than presenting the usual competing input to the two eyes. If the imagery cue also shifted reports on these trials, that would raise concern that participants were favouring the cued answer when reporting what they saw. In the 2018 study, the aphantasia group’s mock-trial priming was not significantly different from 50%. That gives no evidence of a detectable cue-favouring response pattern on those mock trials; it is not proof that all response bias was absent.
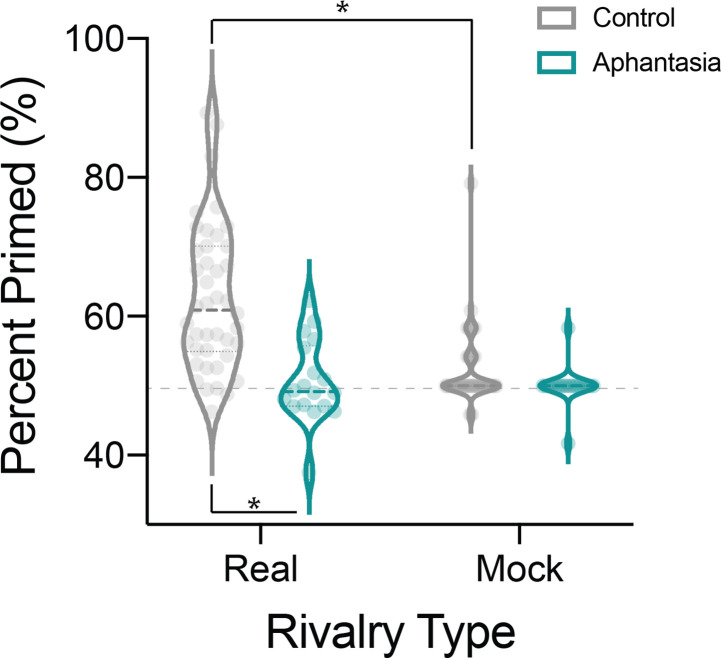
The distinction matters because genuine rivalry can be uncertain in a way a mock display is not. A participant might have little reason to favour the imagined pattern when judging a physically specified mock display, yet favour it when trying to report a fleeting, ambiguous rivalry percept. Thus, an absence of mock-trial bias does not fully rule out bias specific to real rivalry trials. Nor does a nonsignificant result demonstrate that a bias of exactly zero exists.
A later methodological paper makes this limitation explicit. It also explains why responses of “mixed”—neither pattern clearly dominant—matter to the calculation.
Read the task overview and the paper’s response-bias caveat. You do not need to work through its proposed alternative score for this lesson.
In “The binocular rivalry task,” read the task description, stopping before the score formula. Note the “mixed” response and how the conventional score handles it. Near the end of the article, find the paragraph beginning “Lastly, it must be determined”; read the bias caveat. Focus on why mock trials and real rivalry trials may differ as decisions, even when both produce a report of what was seen.
For the conventional priming percentage, mixed responses are excluded: the numerator counts decisive reports matching the imagined pattern, and the denominator counts all decisive reports. This makes the percentage easy to interpret among decisive trials, but it also means that two participants with the same percentage might differ in how often they experienced or reported a mixture. Reporting that percentage without the treatment of mixed trials leaves out part of the method.
The measured outcome is therefore best described carefully: imagining a particular pattern is associated with an increased probability of reporting that pattern during subsequent rivalry in many participants. The task avoids asking them to describe their mental image, which is a valuable difference from a vividness questionnaire. But it does not entirely avoid subjective reports, and its mock trials cannot establish by themselves that the entire effect occurs in perception rather than in the decision about what to report.
What to carry forward
Binocular-rivalry priming tests whether the content of attempted imagery predicts a later perceptual report. Balancing the stimuli helps address pre-existing eye dominance; mock trials probe whether people simply favour the cued response; and the treatment of mixed trials affects the score. In the cited group comparison, people reporting aphantasia showed much less average priming than the general-population sample. That result is informative without serving as a definitive test of any one person’s experience.
The next lesson examines another response to imagined visual content—the pupil’s change during imagined brightness—and asks how actual-light and mental-effort controls help interpret that evidence.