Hello. Last lesson examined whether an imagery instruction changes a later report during binocular rivalry. That method still depends on what a participant says they saw. Here, the measured outcome is different: an eye tracker records pupil size while someone attempts to imagine something bright or dark. The lesson focuses on two controls that make the result interpretable—responses to actual light and responses associated with mental effort.
A pupil can respond for more than one reason
A pupil generally becomes smaller in brighter light and larger in darkness. But pupil size also changes with attention, arousal, and cognitive workload. A change recorded during an imagery task therefore cannot be called an imagined-brightness response merely because it happened while someone was trying to visualize.
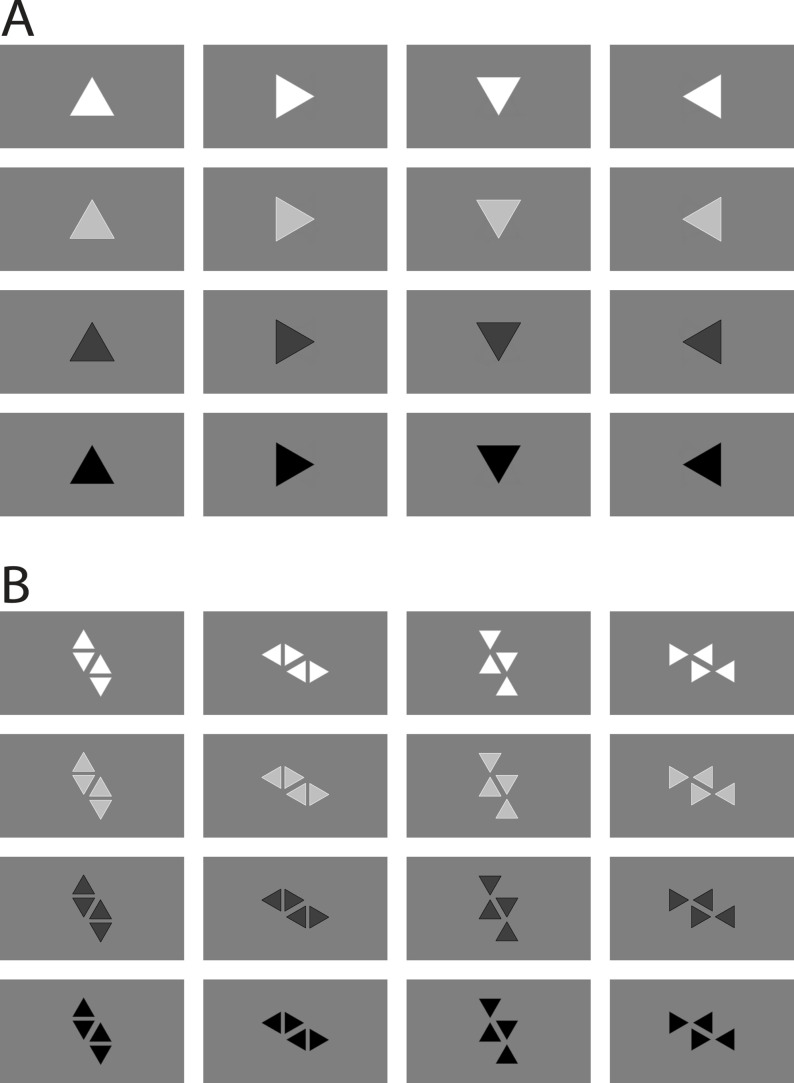
The experiment separates these possibilities by varying two features of simple triangle stimuli: brightness (bright or dark) and set size (one triangle or four). Participants first look at the triangles. After a blank interval intended to let lingering visual effects fade, they are asked to imagine the previously viewed shapes while looking at the same grey screen across imagery conditions. An eye tracker records pupil diameter throughout.
Watch the researcher’s short walkthrough before reading the results. It provides the trial sequence and shows why the two comparisons answer different questions.
Pupils Can Detect Aphantasia with Joel Pearson
In “Pupils Can Detect Aphantasia,” Joel Pearson explains the eye-tracking task and walks through the group plots. Watch for the separate perception and imagery periods, then for the one-versus-four-triangle comparison.
Watch the task setup for the triangle conditions. Continue through the imagery result and the group comparison. Finally, watch the effort control. The video describes the set-size result strongly; as you read on, distinguish evidence of group-level task engagement from proof that every participant exerted equal effort on every trial.
Actual light checks the response the task relies on
During perception, the bright and dark triangles are actually displayed. The expected result is a smaller pupil for the bright condition than for the dark condition. This is the actual-light control: it checks whether participants’ pupils register the visual brightness difference under the experimental setup.
During imagery, the triangles are no longer displayed. The key comparison is again between the bright-triangle and dark-triangle conditions, now based on what participants were instructed to imagine. In the group reporting visual imagery, pupils were smaller on average during bright imagery than during dark imagery. The difference also tended to be larger on trials rated as more vivid.
Read the primary study for the precise procedure and results. Its Figure 1 covers the general-population sample; Figure 3 covers the aphantasia group.
Read the study by Keogh and colleagues to connect the trial design, group plots, and control conditions. Concentrate on the direction of each comparison rather than the statistical notation.
In the results paragraphs immediately above Figure 1, begin where the authors describe presenting one or four bright or dark triangles. Read the main result. In Figure 1’s caption, read the trial timeline to locate the viewing, blank, and imagery periods. Later in the same Figure 1 discussion, read the vividness analysis. Then go to “Aphantasia and the imagery pupillary light response,” directly above Figure 3. Read the group comparison, including the perception and set-size findings. For the lingering-response check, find the paragraph after Figure 3 that begins “Another possible explanation of our findings”; read the carryover analysis. Finally, in “Discussion,” find the paragraph beginning “Could a lack of active engagement during imagery explain the aphantasia results?” and read the authors’ qualification.
The aphantasia group showed a clear bright-versus-dark difference while viewing the triangles, but no statistically detectable bright-versus-dark difference while attempting to imagine them. Their actual-light response matters: without it, an absent imagery difference might simply reflect pupils that did not respond normally to the displayed stimuli. With it, the result points more specifically to what differs between the viewing and imagery periods.
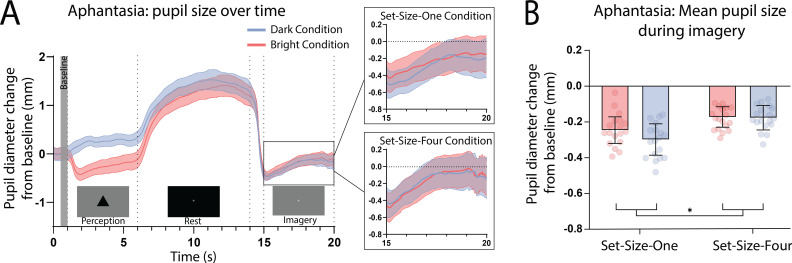
Read the curves as comparisons, not as an absolute measure of anyone’s imagery. In Figure 3, both imagery-condition values can lie below the plotted baseline. The relevant finding is that the bright and dark conditions do not reliably separate in this group, whereas they do in the group reporting imagery. Likewise, “no statistically detectable difference” is not proof that every participant’s difference was exactly zero.
The blank interval and return to a common imagery screen also matter. If the screen still displayed a bright triangle during the imagery period, a smaller pupil would tell us little about imagery. The interval was designed to reduce lingering afterimages; the authors additionally checked whether people with larger pupil responses while viewing the shapes also had larger corresponding imagery responses. Their checks make simple carryover from viewing a less likely explanation, without making every possible carryover effect impossible.
The mental-effort control answers a different objection
A person might understand and work on the instruction without forming a visual picture. Conversely, an absent brightness effect could be difficult to interpret if participants did not engage with the task at all. The set-size comparison helps address that concern.
Maintaining four shapes generally demands more processing than maintaining one. Pupil dilation can accompany increased cognitive load, regardless of whether the load involves visual imagery. In the study, the aphantasia group had larger pupils for four than for one triangle during the imagery period, even though it showed no reliable bright-versus-dark imagery difference. The group reporting imagery also showed a set-size effect.
These findings concern two separable contrasts:
| Imagery-period comparison | What a difference would help indicate |
|---|---|
| Bright versus dark triangles | Sensitivity of the pupil response to the brightness content of attempted imagery |
| Four versus one triangle | Sensitivity to the greater demands of maintaining more items |
The set-size result makes a blanket explanation such as “the aphantasia group simply did nothing” less plausible. It does not establish that every individual tried equally hard, that the two groups used the same mental strategy, or that pupil dilation uniquely measures effort rather than other aspects of engagement or arousal. Most importantly, a larger pupil for four items is not itself evidence of a visual image. It is a different response to a different manipulation.
Taken together, the controls support a narrower, useful interpretation: this group’s pupils responded to actual brightness and to the increased demands of four items, but did not show the brightness-specific response seen during imagery in the comparison group. The pupil measurement is involuntary in a way a vividness rating is not; nevertheless, the inference that it indexes imagery depends on the experimental comparisons. A group result is not a standalone diagnosis from someone’s eyes.
What to carry forward
The imagined-brightness experiment does not treat every pupil change as evidence of visualization. It asks whether bright versus dark imagined content produces a distinct response while the displayed imagery screen is held constant. Actual-light trials check that the brightness response works during viewing; one-versus-four trials provide evidence that participants respond to the task’s cognitive demands. Neither control proves more than its comparison tests.
The next lesson turns to the limits of group-comparison studies, including how recruitment and sample size affect what findings like these can justify about aphantasia more broadly.