Welcome back. In our previous lesson, we successfully transitioned from financial theory to practical application, building clean, structured historical Income Statements and Balance Sheets in Python. We now have a solid foundation of past performance. This lesson marks a pivotal shift in our journey: we will move from analyzing the past to projecting the future.
Our focus today is on developing a set of assumptions to drive our financial projections. Assumptions are the engine of any financial model; they are the structured, defensible hypotheses about the future that translate a company's strategy and its operating environment into a quantitative forecast. Mastering this skill is central to your goal of using financial models for strategic foresight and scenario planning. By the end of this lesson, you will be able to develop a robust and logical set of assumptions that will power your financial projections.
The Heart of the Model: The Assumption Sheet
Before a single number is forecasted, an analyst must first lay out the assumptions. These are the inputs that control the model's behavior and determine its outputs. A well-structured model separates assumptions from calculations, typically in a dedicated section or sheet. This makes the model transparent, flexible, and easy to audit.
Small changes to these assumptions can ripple through the entire model, leading to significant variations in projected outcomes. This sensitivity is not a flaw; it's the model's primary strength. It allows you to quantify the potential impact of strategic decisions and external shocks.
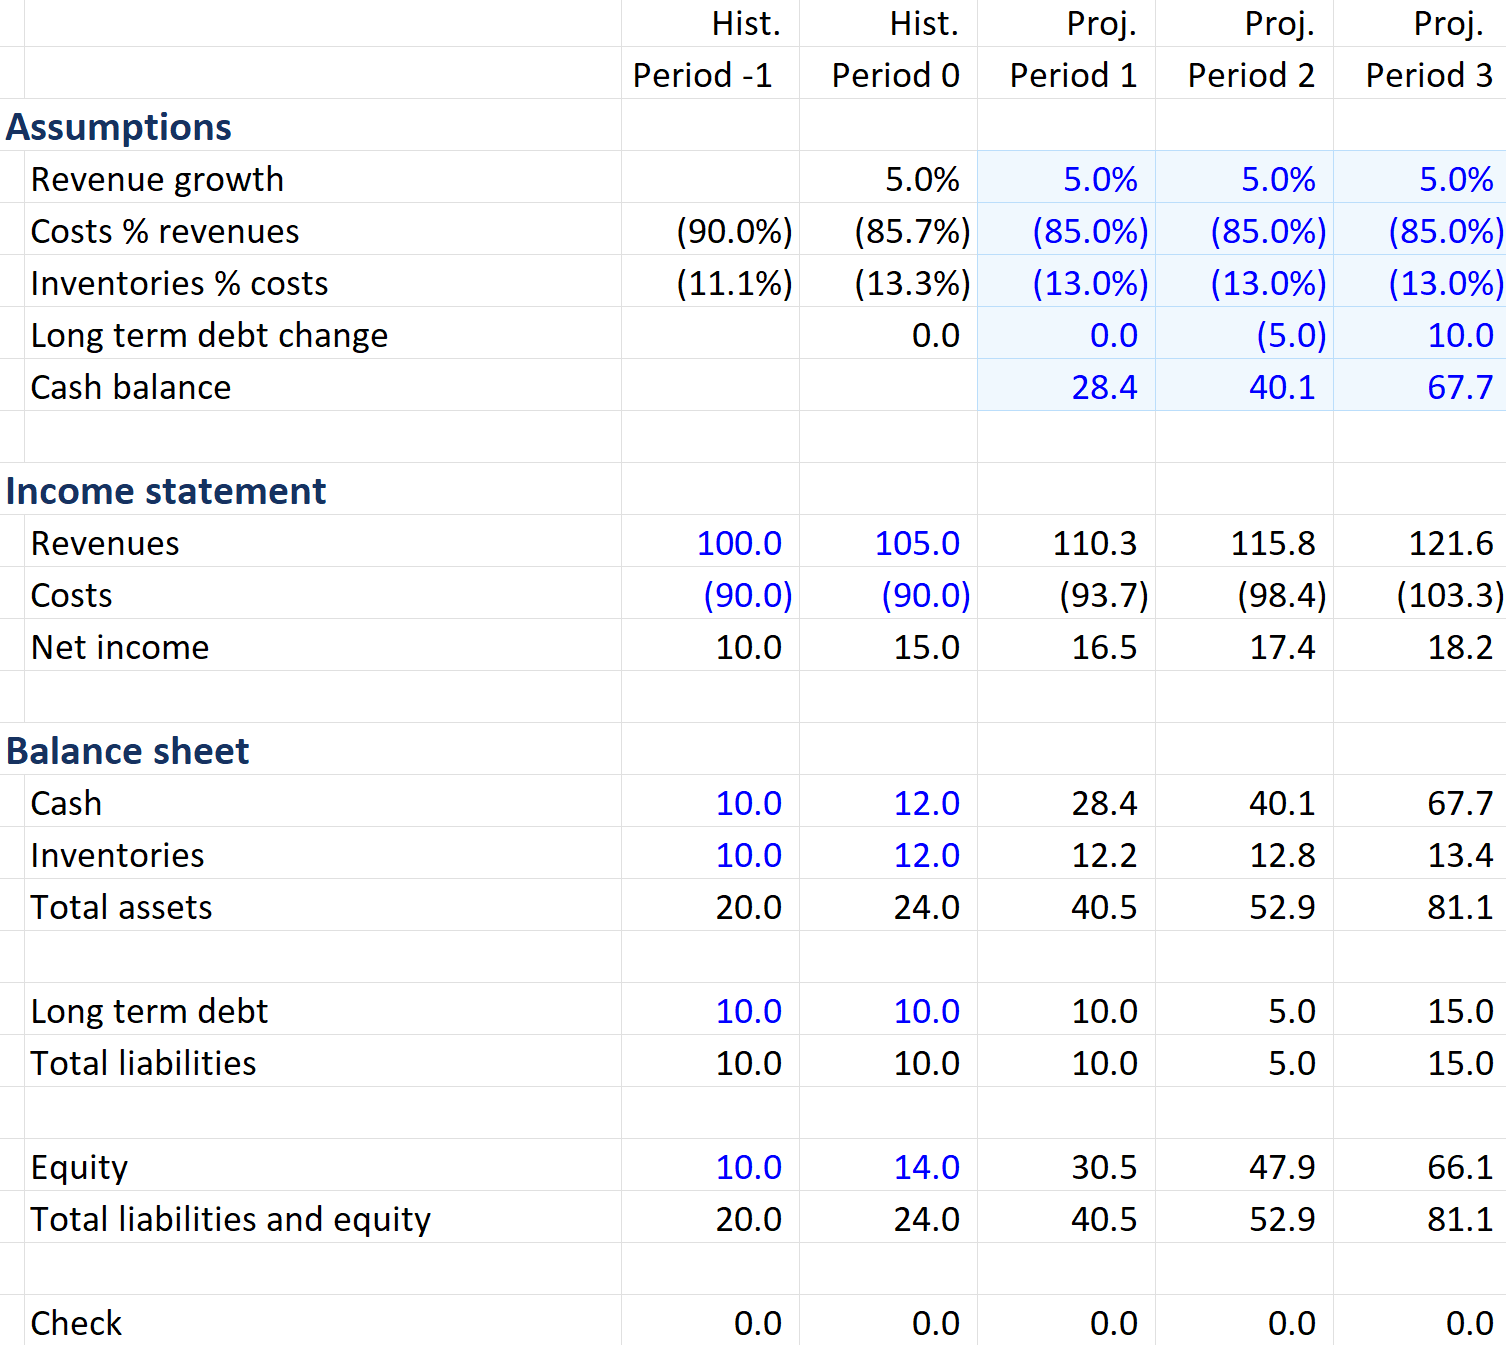
A Framework for Developing Defensible Assumptions
Developing assumptions is not an act of clairvoyance; it is a methodical process that combines quantitative analysis with qualitative judgment. Your extensive background in market research and business intelligence will be invaluable here, as the process involves synthesizing information from multiple sources to form a coherent view of the future.
A great starting point is the comprehensive guide on financial modeling assumptions from the Corporate Finance Institute (CFI). It provides a solid theoretical framework for what assumptions are, the different types, and how to create them.
Financial Modeling Assumptions: What They Are and How ...
This article from CFI provides an excellent overview of the role and development of assumptions in financial modeling. It will serve as our conceptual foundation for this lesson.
Please read the following sections to get a full picture: Begin with the introduction to understand the fundamental role of assumptions. Review the table in the section "Key Types of Assumptions" to see how they are categorized (e.g., Revenue, Cost, Macroeconomic). Carefully study the section "How to Create Reliable Assumptions." This is the most critical part, as it outlines the four pillars of developing assumptions: analyzing historical data, incorporating company strategy, using industry benchmarks, and considering economic indicators. Read the short scenario in "Assumptions in Action" to see a practical example of how assumptions are adjusted. Finally, familiarize yourself with the "Common Mistakes to Avoid" section to learn about frequent pitfalls like over-optimism and inconsistent logic.
As the CFI article highlights, the process of forming assumptions rests on four pillars:
- Historical Performance: Analyzing the financial statements we built in the last lesson to calculate historical growth rates, profit margins, and efficiency ratios. This provides the baseline.
- Company Strategy: Incorporating internal guidance, management plans for new products, market expansion, or efficiency initiatives. Your experience in strategic planning and operating model design is directly applicable here.
- Industry & Competitive Landscape: Benchmarking against competitors and understanding industry-wide trends. This is the domain of market research and competitor intelligence.
- Macroeconomic Environment: Factoring in external forces like inflation, interest rates, and GDP growth.
Practical Techniques for Setting Assumptions
Now let's move from the "what" to the "how." How do analysts combine these inputs into a concrete number for a projection?
Triangulation and Averaging
A common approach, especially for the crucial revenue growth assumption, is to "triangulate" the forecast from several different angles and then find a reasonable synthesis. For costs, analysts often rely on historical averages as a percentage of revenue, assuming a stable cost structure.
The following video demonstrates this practical approach in a spreadsheet, forecasting a P&L by:
- Deriving three different revenue growth rates (from historical trends, investor expectations, and market share analysis).
- Averaging them to arrive at a final revenue assumption.
- Calculating historical averages for Cost of Goods Sold (COGS) and operating expenses as a percentage of revenue to forecast them.
Create P&L Forecast in Under 10 Minutes
This video from "The Financial Controller" offers a clear, step-by-step walkthrough of creating a simple P&L forecast, with a strong focus on how to arrive at the initial assumptions.
Please watch these key segments: Forecasting from past growth: See how historical growth rates are analyzed to project a future growth rate, assuming a slowdown. Incorporating investor expectations: Understand how external targets can provide another data point for your assumption. Using market share analysis: This shows how to build a simple market share model to derive an implied growth rate. Averaging the results: Watch how the three different approaches are combined to create a single, more robust assumption. Forecasting costs as a percentage of revenue: This demonstrates the very common technique of calculating historical expense ratios and using their average for projections.
A More Sophisticated Method: Driver-Based Forecasting
While forecasting based on high-level percentages is common, a more powerful and insightful method is driver-based forecasting. This approach, which aligns perfectly with your background in analytics and business intelligence, involves breaking down a financial metric into its underlying operational drivers.
For example, instead of assuming "revenue will grow by 10%," a driver-based model would forecast:
- Number of new marketing leads
- Lead-to-customer conversion rate
- Average revenue per customer
- Customer churn rate
These drivers are then combined to calculate the revenue forecast. This method creates a direct link between the company's operational activities and its financial outcomes, making it invaluable for strategic planning.
How to EASILY Create a Driver-Based Forecast (FP&A)
Christian Wattig, a former FP&A leader at Unilever, provides a superb explanation of driver-based forecasting and its benefits.
Watch the following sections to understand this powerful technique: What is driver-based forecasting?: A clear definition and contrast with traditional methods. A practical example: See how a subscription company forecasts subscriber numbers by identifying specific drivers like marketing spend and conversion rates, and then builds scenarios around them. Why it works and best practices: Learn about the advantages of this approach, its role in scenario planning, and key implementation tips like focusing on high-impact drivers and collaborating across functions.
Driver-based forecasting transforms the model from a simple financial calculation into a strategic tool. It allows you to ask more specific questions, such as "What is the financial impact of increasing our marketing conversion rate by 0.5%?"
From Concept to Code: Implementing Assumptions in Python
Ultimately, these business rules and drivers must be translated into code. In our upcoming lessons, we will build these forecasts in Python. To give you a preview, let's look at how assumptions can be implemented using simple Python logic.
A common task is to forecast a balance sheet item based on a target ratio. For instance, management may set a goal to reduce "Debtor Days" (the average time to collect payment from customers). We can use this target assumption to forecast the closing Receivables balance. The logic involves rearranging the Debtor Days formula to solve for the Receivables balance, given our forecasted sales.
The tutorial "Financial Forecasting in Python" provides a code snippet for exactly this.
# Assume we have these values from our historical analysis and other assumptions
sales = 156776.0 # Historical sales from last period
ddays = 99 # Target debtor days (our assumption)


# Forecasted sales based on a 10% growth assumption
f_sales = sales * 1.10


# We can rearrange the debtor days formula to solve for the forecasted closing balance of debtors
# Formula: Debtor Days = (Closing Receivables / Sales) * 365
# Rearranged: Closing Receivables = (Sales * Debtor Days) / 365
f_debtors_end = f_sales * ddays / 365

print(f"Projected Receivables Balance: ${f_debtors_end:,.2f}")


# Output: Projected Receivables Balance: $46,775.09
This shows how a strategic goal (a target ratio) directly drives a specific number in our balance sheet forecast.
More complex business logic can be encoded using conditional statements. Imagine a company where sales commissions increase after a certain volume is reached. This is a tiered assumption that can be modeled with an if/else block.
The Python tutorial provides another great example of this, calculating sales revenue based on tiered commissions and COGS based on production capacity thresholds.
Into the Unknown - Financial Forecasting in Python
This article contains several practical Python examples of implementing financial logic. We will focus on a specific section that models dependencies in costs and sales.
Please read the section "Assigning dependencies for sales and COGS". Focus on understanding the business rules for the sales_dep (sales dependency) and cost_dep (cost dependency). The Python code that follows these descriptions implements these rules using simple if/else statements, translating the business logic directly into code.
This example of coding tiered commissions and production costs demonstrates how the nuanced rules of a business are captured in the model's assumptions, making the forecast far more realistic than a simple percentage-based projection.
Conclusion
In this lesson, we established the critical importance of assumptions as the intellectual core of any financial model. You learned that developing defensible assumptions is a systematic process, not guesswork, that draws heavily on skills you already possess in strategy and market analysis.
Key Takeaways:
- Assumptions Drive Forecasts: A model's outputs are a direct function of its input assumptions.
- Separation is Key: Always separate assumptions from calculations for clarity, flexibility, and auditability.
- A Methodical Process: Assumptions are built by analyzing historical data, company strategy, industry benchmarks, and macroeconomic factors.
- Practical Techniques: Simple methods like using historical averages for costs and triangulating revenue growth are common, while driver-based forecasting provides a more sophisticated and powerful alternative.
- Assumptions as Code: Business rules, drivers, and targets are ultimately translated into the logic of your model, whether in a spreadsheet or a Python script.
We have now laid all the necessary groundwork. You've prepared the historical data, and you understand how to develop the assumptions that will drive your forecast. In our next lesson, we will begin the exciting work of building the forecast itself. We will start with the most important line item: revenue. You will forecast revenue from historical data using a linear trend method in Python.
