Hello! Welcome back to our module on Container Observability.
In our previous lessons, we dove deep into the "L" of observability: Logs. You learned how to configure application containers to forward logs to centralized systems like the EFK stack and Grafana Loki, covering both stdout-based and file-based logging patterns.
Today, we shift our focus to the "M": Metrics. While logs tell us what happened, metrics tell us how the system is performing. Our goal for this lesson is to learn how to configure the Docker daemon to expose its own internal metrics in Prometheus format. This is a foundational step in monitoring the health and performance of the container runtime itself—a critical piece of infrastructure in any environment you manage.
Why Monitor the Docker Daemon?
Before we jump into the configuration, let's understand why this is so important. The Docker daemon manages everything: images, containers, networks, and volumes. Exposing its metrics gives you visibility into:
- The number of running, stopped, or paused containers.
- Build and image pull performance.
- Errors and events happening inside the daemon.
- Resource usage related to the engine's operations.
This data is invaluable for setting up alerts and building dashboards. For instance, you could create an alert that fires if the Docker daemon becomes unresponsive or if you have an unusual number of stopped containers, which might indicate a deployment issue.
The diagram below shows a typical monitoring architecture. Today, we are enabling the connection highlighted in red: making the Docker Daemon's metrics available to a scraper like Prometheus.
Docker daemon monitoring architecture
This diagram from a OneUptime blog post illustrates how a Prometheus server scrapes metrics directly from the Docker Daemon, in parallel with scraping container-specific stats from an agent like cAdvisor.
Enabling the Metrics Endpoint in daemon.json
The Docker daemon is configured using a JSON file, typically located at /etc/docker/daemon.json on Linux systems. If this file doesn't exist, you'll need to create it. To expose metrics, we need to add a couple of keys to this file.
The official Docker documentation provides a clear guide on this process.
Collect Docker metrics with Prometheus
Let's start with the official source. This documentation page explains exactly how to configure the daemon to expose Prometheus-compatible metrics.
Read the introduction and the 'Configure the daemon' section. Pay close attention to the metrics-addr key and the security note about using 127.0.0.1 versus 0.0.0.0.
As the documentation states, you need to add the metrics-addr key to your daemon.json file. You might also see experimental: true in many tutorials; this was required in older Docker versions but metrics are now a stable feature. It's often included for backward compatibility.
Here is the configuration you'll need:
{
  "metrics-addr": "0.0.0.0:9323",
  "experimental": true
}
"metrics-addr": This tells Docker to open a web server on port9323to serve the metrics."experimental": Enables experimental features, which historically included the metrics endpoint.
After adding this configuration, you must restart the Docker daemon for the changes to take effect:sudo systemctl restart docker
A Practical Walkthrough and a Key Gotcha
Reading about it is one thing, but seeing it in action is better. The following video provides a step-by-step guide on a Linux system, which aligns well with your DevOps experience. It also highlights a very common issue you might encounter.
Docker Monitoring With Prometheus And Grafana | etc/docker/daemon.json | Thetips4you
This video from Thetips4you demonstrates the entire process, including a crucial troubleshooting step.
Watch from 01:22 to 05:41. The presenter first tries configuring with 127.0.0.1 and shows that it doesn't work for external access. Then, they correct it to 0.0.0.0. This is a critical learning point.
127.0.0.1 vs. 0.0.0.0: What's the Difference?
This is a fundamental networking concept that is especially important in the world of containers.
127.0.0.1(localhost): When a service binds to this address, it only accepts connections originating from the same machine. A Prometheus container, even one running on the same host, has its own network namespace and cannot reach the host's127.0.0.1address directly.0.0.0.0(wildcard address): When a service binds to this address, it accepts connections on all available network interfaces of the host. This makes the metrics endpoint accessible to other machines and, importantly, to containers running on the host.
As the Docker documentation mentions, binding to 0.0.0.0 exposes the port to your network. You must ensure that your host's firewall (e.g., ufw, firewalld) is configured to restrict access to this port if needed.
Verifying the Configuration
Once you've edited daemon.json and restarted Docker, you can verify that it's working by using curl or your web browser to access the metrics endpoint.
From your Docker host's terminal, run:curl http://localhost:9323/metrics
You should see a large block of text output, with each line representing a specific metric. This is the raw Prometheus exposition format.
Here are a few examples of metrics you'll find:
engine_daemon_container_states_containers{state="running"}: A gauge showing the number of currently running containers.engine_daemon_network_actions_seconds_count: A counter for network actions performed by the daemon.engine_daemon_build_cache_hits_total: A counter for the number of build cache hits, useful for optimizing Dockerfiles.
Test your understanding!
You have configured the Docker daemon with "metrics-addr": "127.0.0.1:9323". You then deploy a Prometheus container on the same host to scrape this endpoint. The scrape fails. Why? What change is needed to fix it?
Show answer
The scrape fails because the metrics endpoint is bound to 127.0.0.1, which is the host's loopback interface. The Prometheus container exists in its own isolated network namespace and cannot access the host's loopback interface.
To fix this, you must change the configuration in daemon.json to "metrics-addr": "0.0.0.0:9323" and restart the Docker daemon. This binds the port to all of the host's network interfaces, making it accessible from the Prometheus container (and other devices on the network).
Configuration on Docker Desktop
If you're using Docker Desktop on Windows or macOS, the process is slightly different as you don't directly edit /etc/docker/daemon.json. Instead, you use the application's GUI.
- Go to Settings > Docker Engine.
- You will see a JSON editor where you can add the same configuration keys.
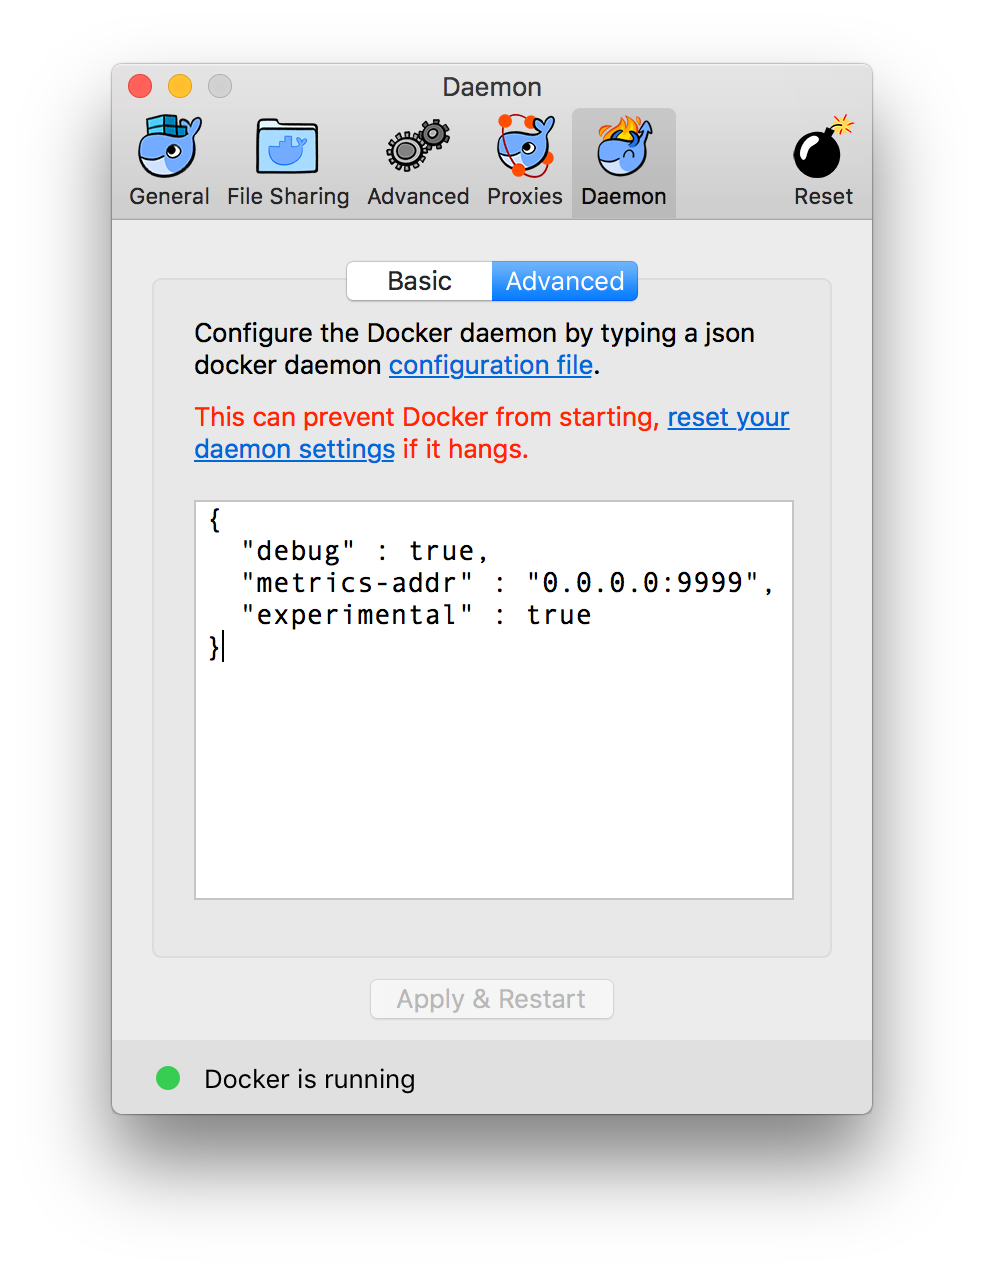
After you click "Apply & Restart", Docker Desktop will handle the rest. To allow a container to scrape the host, you can use the special DNS name host.docker.internal in your Prometheus configuration, which resolves to the host's internal IP address. For example: targets: ["host.docker.internal:9323"].
Conclusion
You have now successfully configured your Docker daemon to act as a data source for Prometheus. This is a critical step in establishing comprehensive monitoring for your containerized infrastructure.
Key Takeaways:
- The Docker daemon can expose a rich set of internal metrics about its own performance and the state of containers, images, and networks.
- This is enabled by adding the
metrics-addrkey to thedaemon.jsonconfiguration file and restarting Docker. - Using
0.0.0.0for the address is necessary to allow containers (like a Prometheus scraper) to access the metrics endpoint. - You can verify the setup by accessing the
/metricsendpoint on the configured port (e.g.,9323).
In our next lesson, we'll put this data to use. You will deploy a Prometheus and Grafana stack to scrape and visualize these Docker metrics, turning that raw text output into meaningful dashboards and graphs.