Hello! Welcome back to our module on container observability.
In our last lesson, you successfully configured the Docker daemon to expose its internal metrics, opening up a stream of valuable data about the container engine's health and performance. We now have a /metrics endpoint ready to be scraped.
Today, we'll build on that foundation to achieve our goal: deploying a complete Prometheus and Grafana stack to scrape and visualize Docker metrics. We'll move beyond the raw text output of the metrics endpoint and turn it into actionable, easy-to-understand dashboards. You'll learn how to set up the entire stack using Docker Compose, configure Prometheus to gather data from multiple sources, and use Grafana to bring that data to life.
The Full Monitoring Stack Architecture
While the Docker daemon provides great metrics about the engine, a comprehensive monitoring setup also needs to see what's happening inside each container. For this, we'll introduce a few key components that work together:
- Prometheus: Our central time-series database. It actively "scrapes" (pulls) metrics from configured endpoints and stores them.
- cAdvisor (Container Advisor): An exporter from Google that specializes in collecting detailed resource usage and performance data from running containers (CPU, memory, network, etc.).
- Node Exporter: A Prometheus exporter that provides detailed metrics about the host machine (the node), such as CPU, memory, and disk I/O of the underlying server.
- Grafana: The visualization layer. It queries Prometheus and renders the data in powerful, customizable dashboards.
The diagram below illustrates how these components fit together.
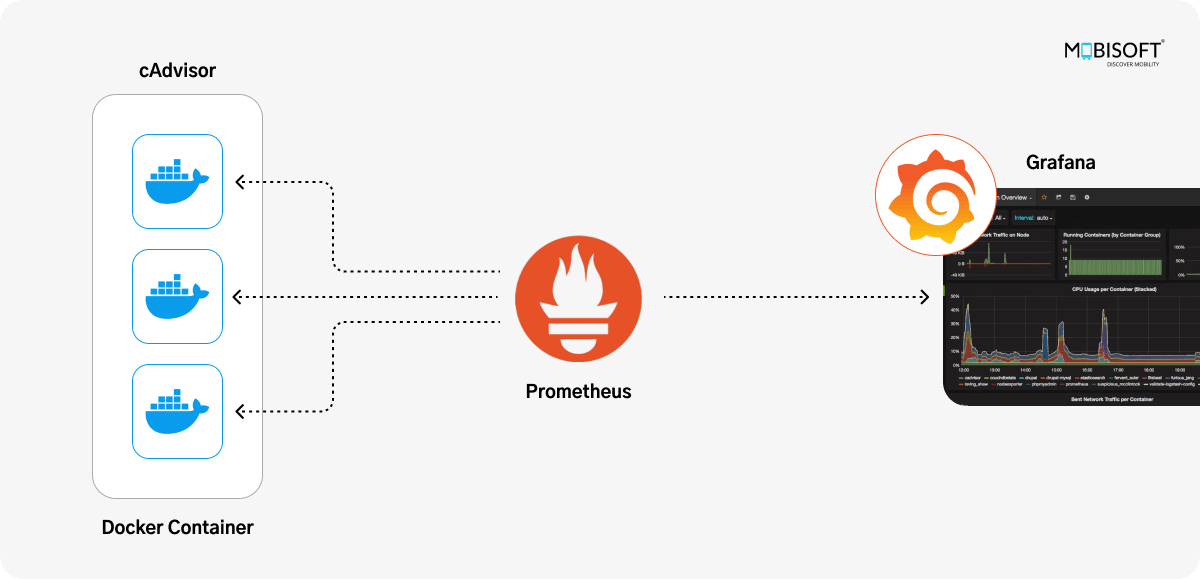
Today, we will build this entire stack, and we will configure Prometheus to scrape both cAdvisor and the Docker daemon metrics endpoint you enabled in the last lesson. This will give you a complete view of your containerized environment.
Step 1: Defining the Stack with Docker Compose
Given your experience with DevOps and Docker Compose, we'll define our entire monitoring stack in a single docker-compose.yml file. This approach makes the stack portable, version-controllable, and easy to manage.
Create a new directory for this project. Inside it, create a file named docker-compose.yml.
my-monitoring-stack/
└── docker-compose.yml
Copy the following content into your docker-compose.yml file. This configuration is based on a common professional setup.
version: '3.8'

volumes:
  prometheus_data: {}
  grafana_data: {}

networks:
  monitoring:
    driver: bridge

services:
  prometheus:
    image: prom/prometheus:latest
    container_name: prometheus
    volumes:
      - ./prometheus/:/etc/prometheus/
      - prometheus_data:/prometheus
    command:
      - '--config.file=/etc/prometheus/prometheus.yml'
      - '--storage.tsdb.path=/prometheus'
    ports:
      - "9090:9090"
    networks:
      - monitoring
    # This entry makes the host's IP address available to the container
    # under the name 'host.docker.internal'. It's crucial for scraping the Docker daemon.
    extra_hosts:
      - "host.docker.internal:host-gateway"
    restart: unless-stopped

  cadvisor:
    image: gcr.io/cadvisor/cadvisor:latest
    container_name: cadvisor
    volumes:
      - /:/rootfs:ro
      - /var/run:/var/run:rw
      - /sys:/sys:ro
      - /var/lib/docker/:/var/lib/docker:ro
    ports:
      - "8080:8080"
    networks:
      - monitoring
    restart: unless-stopped

  grafana:
    image: grafana/grafana:latest
    container_name: grafana
    volumes:
      - grafana_data:/var/lib/grafana
    environment:
      - GF_SECURITY_ADMIN_USER=admin
      - GF_SECURITY_ADMIN_PASSWORD=admin
    ports:
      - "3000:3000"
    networks:
      - monitoring
    restart: unless-stopped
A quick breakdown of this file:
services: We define three services:prometheus,cadvisor, andgrafana.volumes: We use named volumes (prometheus_data,grafana_data) to persist data even if the containers are removed. We also use bind mounts to inject configuration files (e.g., for Prometheus).networks: All services are attached to a custom bridge network calledmonitoring. This allows them to communicate with each other using their service names as hostnames (e.g.,http://prometheus:9090).extra_hosts: Thehost.docker.internal:host-gatewayentry in the Prometheus service is a modern, reliable way to allow a container to reach services running on the host machine. We'll use this to scrape the Docker daemon's metrics endpoint.
Step 2: Configuring Prometheus Scrape Targets
Prometheus needs a configuration file to know which endpoints to scrape. Create a prometheus directory and a prometheus.yml file inside it.
my-monitoring-stack/
├── docker-compose.yml
└── prometheus/
    └── prometheus.yml
Paste the following configuration into prometheus/prometheus.yml.
global:
  scrape_interval: 15s

scrape_configs:
  - job_name: 'prometheus'
    static_configs:
      - targets: ['localhost:9090']

  - job_name: 'cadvisor'
    static_configs:
      - targets: ['cadvisor:8080']

  - job_name: 'docker-daemon'
    static_configs:
      - targets: ['host.docker.internal:9323']
Here, we've defined three scrape_configs jobs:
prometheus: To monitor Prometheus itself.cadvisor: To scrape container metrics from cAdvisor. It uses the service namecadvisorsince they are on the same Docker network.docker-daemon: To scrape the Docker daemon metrics you enabled in the last lesson. It useshost.docker.internalto reach the host machine's port9323.
Step 3: Launch and Verify the Stack
Now, you're ready to bring everything online.
- Open a terminal in the
my-monitoring-stackdirectory. - Run
docker-compose up -d. This will pull the images and start the three containers in the background. - Verify that all containers are running with
docker ps. You should seeprometheus,cadvisor, andgrafana.
Next, let's verify that Prometheus is successfully scraping all its targets.
- Open your browser and navigate to the Prometheus UI:
http://localhost:9090. - Go to the Status > Targets page.
The following video shows what you should be looking for on the Targets page.
Monitor Docker Containers Like a Pro with Grafana & Prometheus
This clip from Ehsan's Tech Cave demonstrates how to check the status of scrape targets in the Prometheus UI. A state of 'UP' means everything is working correctly.
Watch from 05:48 to 06:20. Notice how the presenter navigates to the 'Targets' page and confirms that the endpoint is 'UP'. You should see all three of your jobs ('prometheus', 'cadvisor', and 'docker-daemon') with a state of 'UP'.
If any target is DOWN, double-check your configuration files and ensure the Docker daemon metrics endpoint is still active.
Step 4: Visualizing Metrics in Grafana
With data flowing into Prometheus, it's time to visualize it.
- Open Grafana in your browser:
http://localhost:3000. - Log in with the default credentials: username
adminand passwordadmin. Grafana will prompt you to set a new password.
Connecting Grafana to Prometheus
First, you need to tell Grafana where to find your data. You'll add Prometheus as a data source. The process is straightforward, as shown in this next video clip.
Monitor Docker Containers Like a Pro with Grafana & Prometheus
This video walks through adding Prometheus as a data source in Grafana and importing a pre-built dashboard.
Watch from 06:20 to 08:00. Follow the steps to add the Prometheus data source. For the URL, use http://prometheus:9090. Then, follow the instructions to import a dashboard by ID. A popular and effective dashboard for Docker and system monitoring is ID 193 (for cAdvisor) or 893.
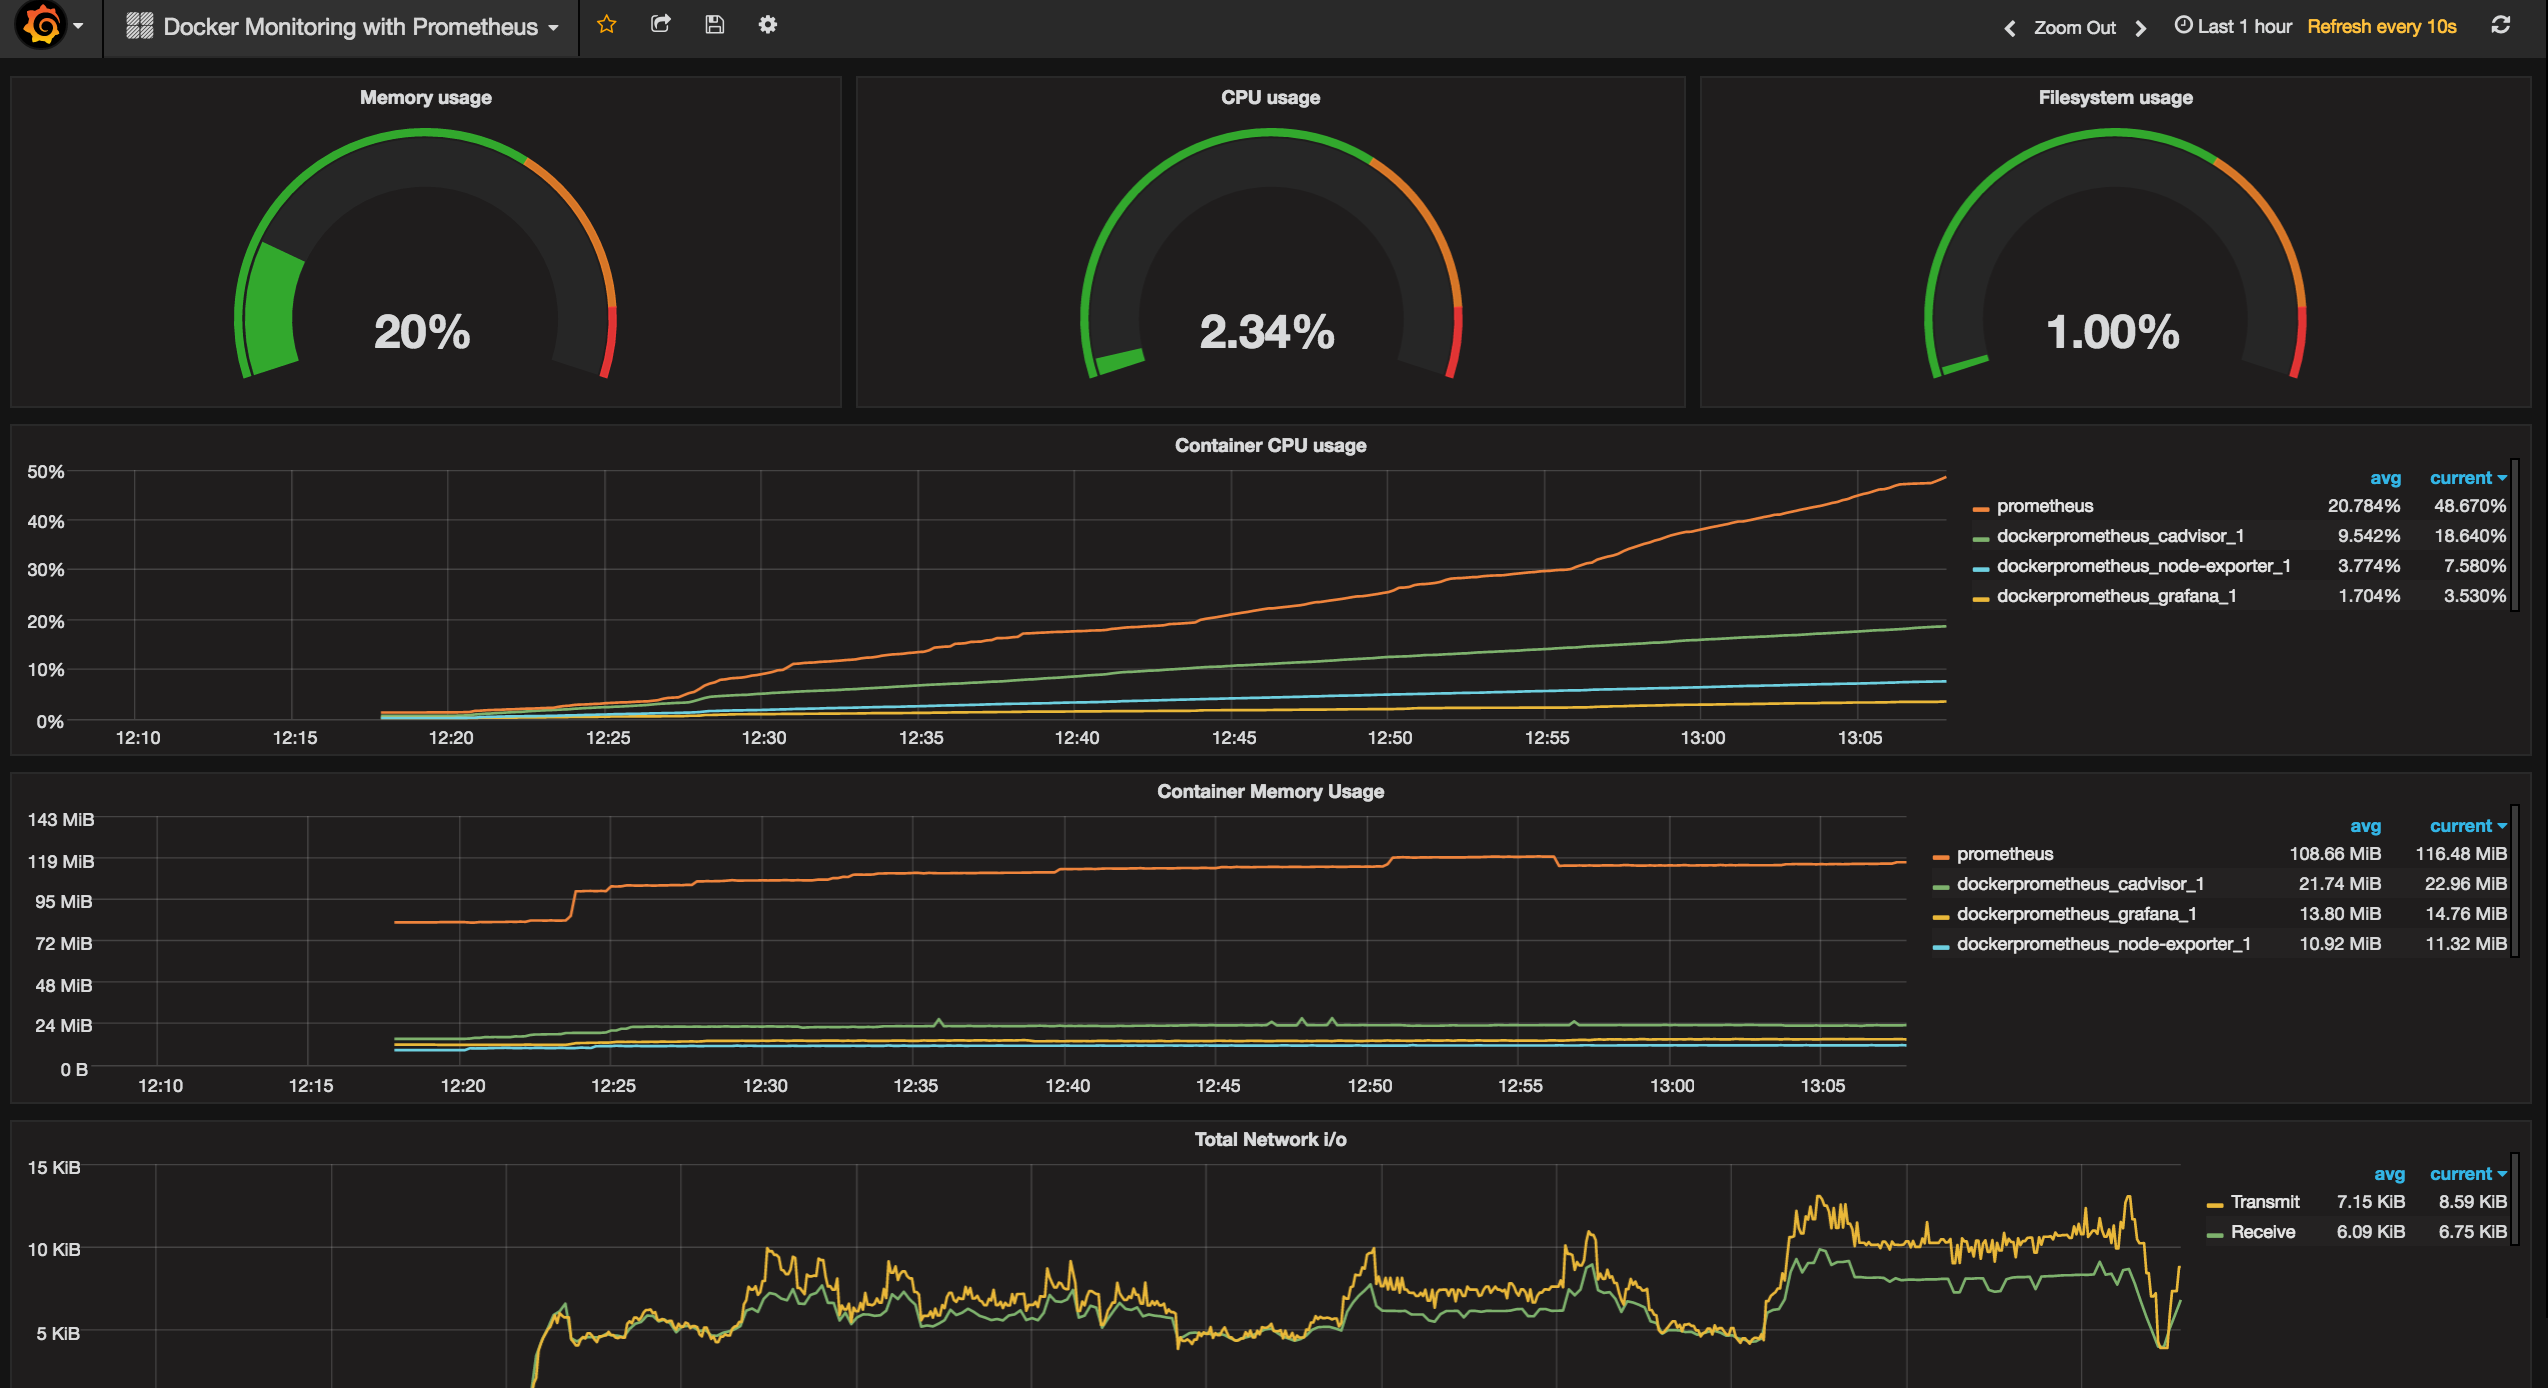
Importing a dashboard from the Grafana community is the fastest way to get a rich visualization. After you import the dashboard, you should see a detailed overview of your running containers.
Test your understanding!
In your prometheus.yml file, the target for the docker-daemon job is host.docker.internal:9323. In the cadvisor job, the target is cadvisor:8080. Why are these addresses different? Why can't we use localhost for both?
Show answer
The addresses are different because of their location relative to the Prometheus container's network.
cadvisor:8080: Thecadvisorcontainer is running on the same Docker network (monitoring) as theprometheuscontainer. Docker's internal DNS resolves the service namecadvisorto its container's IP address on that network.host.docker.internal:9323: The Docker daemon's metrics endpoint is running directly on the host machine, outside the Docker network.host.docker.internalis a special DNS name that resolves to the host's IP address, allowing the Prometheus container to reach it.
We can't use localhost because inside a container, localhost refers to the container itself, not the host machine.
A Note on Provisioning (The DevOps Way)
While adding data sources and dashboards manually via the UI is fine for getting started, in a professional CI/CD environment, you'd want this to be automated. Grafana supports "provisioning," where you can define data sources and dashboards in YAML/JSON files. When Grafana starts, it automatically configures itself.
The Prometheus with Docker Compose article we've referenced provides an excellent example of this. You could extend your docker-compose.yml to mount these provisioning files into the Grafana container, fully automating your setup. This is a powerful pattern to keep in mind for production environments.
Conclusion
Congratulations! You have successfully deployed a production-grade monitoring stack for Docker using Prometheus and Grafana. You now have visibility into both the Docker engine itself and the individual containers it manages.
Key Takeaways:
- A complete monitoring stack typically consists of Prometheus, Grafana, and one or more exporters like cAdvisor.
- Docker Compose is an ideal tool for defining, deploying, and managing this multi-container application.
- Prometheus is configured with a
prometheus.ymlfile to define scrape jobs for different metric sources. - Special networking configurations like
extra_hostsorhost.docker.internalare needed for containers to scrape metrics from the host. - Grafana visualizes Prometheus data, and importing community dashboards is an efficient way to get started.
In our next lesson, we will dive deeper into troubleshooting and inspection. You will learn how to inspect the state of Docker objects and monitor daemon events for in-depth troubleshooting, using commands like docker inspect and docker events.