Hello! Welcome to the final lesson in our module on container observability.
In our last session, we built a fantastic high-level monitoring stack with Prometheus and Grafana. This gives you a "macro" view of your container ecosystem, perfect for spotting trends and anomalies from a distance. However, when a dashboard alert goes off or a container misbehaves, you need to zoom in—fast.
Today, we shift from the macro to the "micro" view. This lesson is all about equipping you with the command-line tools for surgical, in-depth troubleshooting. We will cover how to inspect the state of any Docker object and monitor real-time daemon events. Mastering these skills is what separates a good DevOps engineer from a great one, enabling you to diagnose and resolve issues with precision and speed.
The Docker Container Lifecycle
Before we dive into inspection, it's helpful to have a clear mental model of a container's lifecycle. Every Docker container moves through a series of states, from creation to deletion.
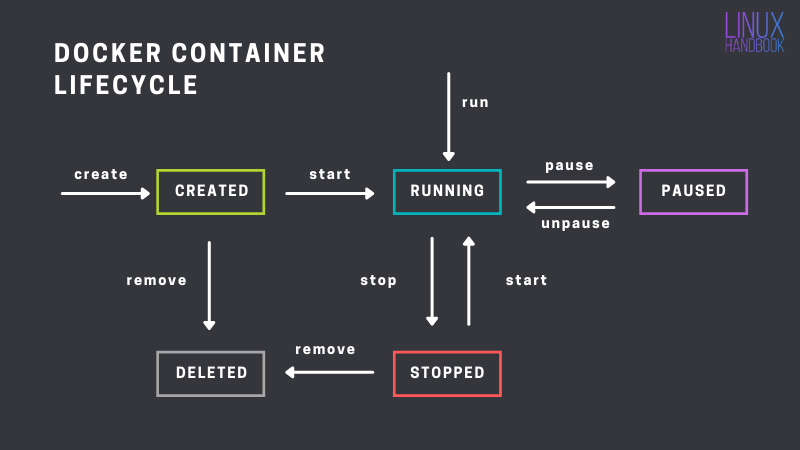
Understanding this lifecycle is key, as the tools we'll use today allow you to pinpoint a container's exact state and investigate why it got there.
1. Deep Dives with docker inspect
When you need to know everything about a Docker object—be it a container, image, network, or volume—docker inspect is your go-to command. It returns a detailed JSON document containing the object's entire configuration and current state.
To get a feel for the depth of information available, let's start a simple container and inspect it.
# Run a detached nginx container
docker run -d --name webserver -p 8080:80 nginx

# Now, inspect it
docker inspect webserver
You'll see a large JSON output. Don't be overwhelmed! We'll focus on the most critical sections for troubleshooting.
Key Information in Container Inspection
State: Provides runtime information.Status:running,paused,exited.Running:trueorfalse.ExitCode:0for a clean exit, non-zero for an error. This is vital for debugging failed containers.OOMKilled:trueif the container was killed by the kernel's Out-Of-Memory manager.
NetworkSettings: Details all network configurations.IPAddress: The container's internal IP address on the Docker network.Ports: Shows the mapping between host ports and container ports (e.g.,80/tcpmapped to host port8080).
Mounts: A list of any volumes or bind mounts attached to the container, including their source on the host and destination in the container.Config: The configuration you defined when creating the container.Env: A list of environment variables.CmdandEntrypoint: The command the container runs on startup.
Filtering Output with Go Templates
Piping the full JSON output to tools like jq is powerful, but Docker provides a built-in way to extract specific fields using the --format (-f) flag and Go template syntax. This is extremely useful for scripting and quick checks.
For a comprehensive guide on using docker inspect with various objects and filtering techniques, the following resource is excellent.
How to Use Docker Inspect Command
Please read through the 'Docker Inspect Basics' and 'Inspecting Docker Objects' sections of the tutorial 'How to Use Docker Inspect Command' from labex.io. This will give you a solid foundation.
Focus on the syntax and the examples provided for inspecting containers, images, and networks. Pay close attention to the use of the --format flag.
Here are some practical examples of formatted inspection:
# Get a container's IP address
docker inspect -f '{{.NetworkSettings.IPAddress}}' webserver

# Check the exit code of a stopped container (first, stop it)
docker stop webserver
docker inspect -f '{{.State.ExitCode}}' webserver

# Check a container's port mappings
docker inspect -f '{{json .NetworkSettings.Ports}}' webserver | jq

# See all environment variables
docker inspect -f '{{.Config.Env}}' webserver
Test your understanding!
Using the webserver container we created, how would you write a single docker inspect command to retrieve the driver used for its storage (e.g., overlay2)? (Hint: This information is located in Driver within the GraphDriver object).
Show answer
You would use the --format flag with the correct path in the JSON structure:
docker inspect -f '{{.GraphDriver.Name}}' webserver
2. Monitoring Real-time Daemon Activity with docker events
While docker inspect gives you a snapshot in time, docker events provides a real-time stream of activities occurring within the Docker daemon. It's like tailing a log file specifically for Docker's structural changes.
Run this command in your terminal:
docker events
Now, in a second terminal, start and stop a container (e.g., docker start webserver, docker stop webserver). You'll see events for start, die, and stop appear in the first terminal.
The raw output is useful but can be noisy. Just like inspect, events supports filtering and formatting to help you focus on what matters.
# Filter for only container-related events
docker events --filter 'type=container'

# Filter for only container 'stop' events
docker events --filter 'type=container' --filter 'event=stop'

# Format the output for better readability
docker events --filter 'type=container' --format '{{.Time}} | {{.Action}} | {{.Actor.Attributes.name}}'
This becomes incredibly powerful for diagnosing "flapping" containers that are caught in a restart loop. A quick look at docker events would show a rapid succession of start and die events, immediately pointing you to the problem.
For more examples, please review the "Container Events" section in the following guide.
Docker Logs and Troubleshooting: Complete Practical Guide
The 'Docker Logs and Troubleshooting' guide from Cubepath has a concise section on docker events that demonstrates useful filtering and formatting options.
Navigate to the 'Container Events' section within the 'Monitoring and Alerting' part of the article. Try running the example commands.
3. A Systematic Approach to Troubleshooting
Now let's combine these tools to tackle common problems. As a DevOps engineer, you'll often be the first line of defense when a service goes down.
Scenario 1: A Container Fails to Start
You run docker-compose up or docker run, and the container exits immediately with an error.
- Check the logs: The first step is always
docker logs <container_name_or_id>. This often reveals application-level errors. - Inspect the exit code: If the logs are unhelpful, find the exit code.
The resource below provides a handy list of common exit codes. For example,docker inspect <container_id> -f '{{.State.ExitCode}}'127means "command not found," pointing to a likely error in your Dockerfile'sCMDorENTRYPOINT. - Debug interactively: If a container exits too quickly to use
docker exec, you can override its entrypoint to get a shell inside the image's environment. This lets you poke around, check for missing files, or test commands manually.# Instead of letting it run its default command, start a shell docker run -it --entrypoint /bin/sh my-faulty-image
Scenario 2: Container is Running but Unresponsive
The container is UP according to docker ps, but the application isn't working.
- Get a shell inside:
docker execis your best friend here. It lets you run commands inside the running container.
To truly understand what thedocker exec -it <container_name_or_id> /bin/bash # (If bash isn't available, try /bin/sh)-itflags do, the following video gives an excellent explanation. Given your CS background, you'll appreciate the breakdown ofstdin,stdout, and TTYs.
Manipulate Docker Containers | Top Commands used to Interact with Docker Containers | Geekific
This clip from the 'Manipulate Docker Containers' video by Geekific explains the -i (interactive) and -t (TTY) flags, which are crucial for interactive debugging sessions inside a container.
Watch from 05:45 to 08:57. The first part explains the theory behind the flags, and the second part shows the practical use of getting a shell with sh.
- Investigate from within: Once inside, you can use standard Linux utilities to diagnose the problem.
- Check running processes:
ps auxortop. Is the main application process running? - Check network listeners:
netstat -tuln. Is your app listening on the expected port? - Test connectivity:
pingorcurlother services or external endpoints. Is there a network issue?
- Check running processes:
- Inspect network and mounts: From the host, use
docker inspectto verify that port mappings and volume mounts are configured as you expect. A common mistake is mapping the wrong host port or mounting a volume to the wrong path.
The guide below provides excellent, command-line-focused solutions for these and other common issues like permission errors, OOM kills, and DNS problems.
Docker Logs and Troubleshooting: Complete Practical Guide
To consolidate your troubleshooting workflow, read the 'Debugging Containers' and 'Common Issues and Solutions' sections of this practical guide.
This is a great reference to bookmark. Focus on the scenarios for 'Container Won't Start', 'Container Exits Immediately', and 'Permission Denied Errors'. Note the systematic use of docker logs, docker inspect, and docker exec.
Conclusion
You've now added two of the most powerful diagnostic tools in the Docker CLI to your arsenal. While high-level dashboards are essential for monitoring, docker inspect and docker events are the precision instruments you'll rely on for deep, effective troubleshooting.
Key Takeaways:
docker inspectis your tool for a deep, static analysis of any Docker object, providing a complete JSON representation of its configuration and state.- The
--formatflag allows you to script and automate checks by extracting specific data points from the inspection output. docker eventsprovides a real-time stream of daemon activities, perfect for catching transient issues and understanding the dynamics of your containers.- A robust troubleshooting workflow combines
docker logs,docker ps -a,docker inspect, anddocker execto systematically diagnose problems from the application layer down to the container configuration.
This lesson concludes our module on container observability and troubleshooting. You're now equipped to not only monitor your containers from a high level but also to dive deep and solve problems when they arise.
In our next module, "Performance Tuning and Optimization," we will shift from reactive troubleshooting to proactive optimization. We'll start by exploring how to reduce final image size by selecting minimal base images like Alpine or distroless, a crucial step for improving security, performance, and deployment speed.