Hello! Welcome back to our module on Container Observability.
In our last lesson, you successfully deployed a full EFK (Elasticsearch, Fluentd, Kibana) stack using Docker Compose. We configured an Apache container to forward its stdout/stderr logs to Fluentd by setting the logging driver in the docker-compose.yml file. This is a powerful, straightforward pattern for applications that follow the 12-factor app methodology.
Today, we'll expand on this to fully achieve our learning outcome: Configure application containers to forward logs to a centralized aggregator. We'll explore alternative methods and backends, giving you the flexibility to handle different types of applications and logging requirements—a crucial skill for any DevOps role.
We will cover two primary strategies:
- Using a different Docker Logging Driver: We'll switch from the EFK stack to the leaner Grafana Loki and configure our application to send logs to it using its dedicated driver.
- The Log Shipper Pattern: We'll tackle the common scenario where an application writes logs to a file instead of
stdout, and use a dedicated logging agent to collect and forward them.
1. Recap and Architectural Overview
As a quick refresher, the Docker daemon can be configured to intercept the standard output (stdout) and standard error (stderr) streams of a container and route them to a specified logging driver. The default is json-file, but as you've seen, this can be changed to fluentd, syslog, gelf, and many others.
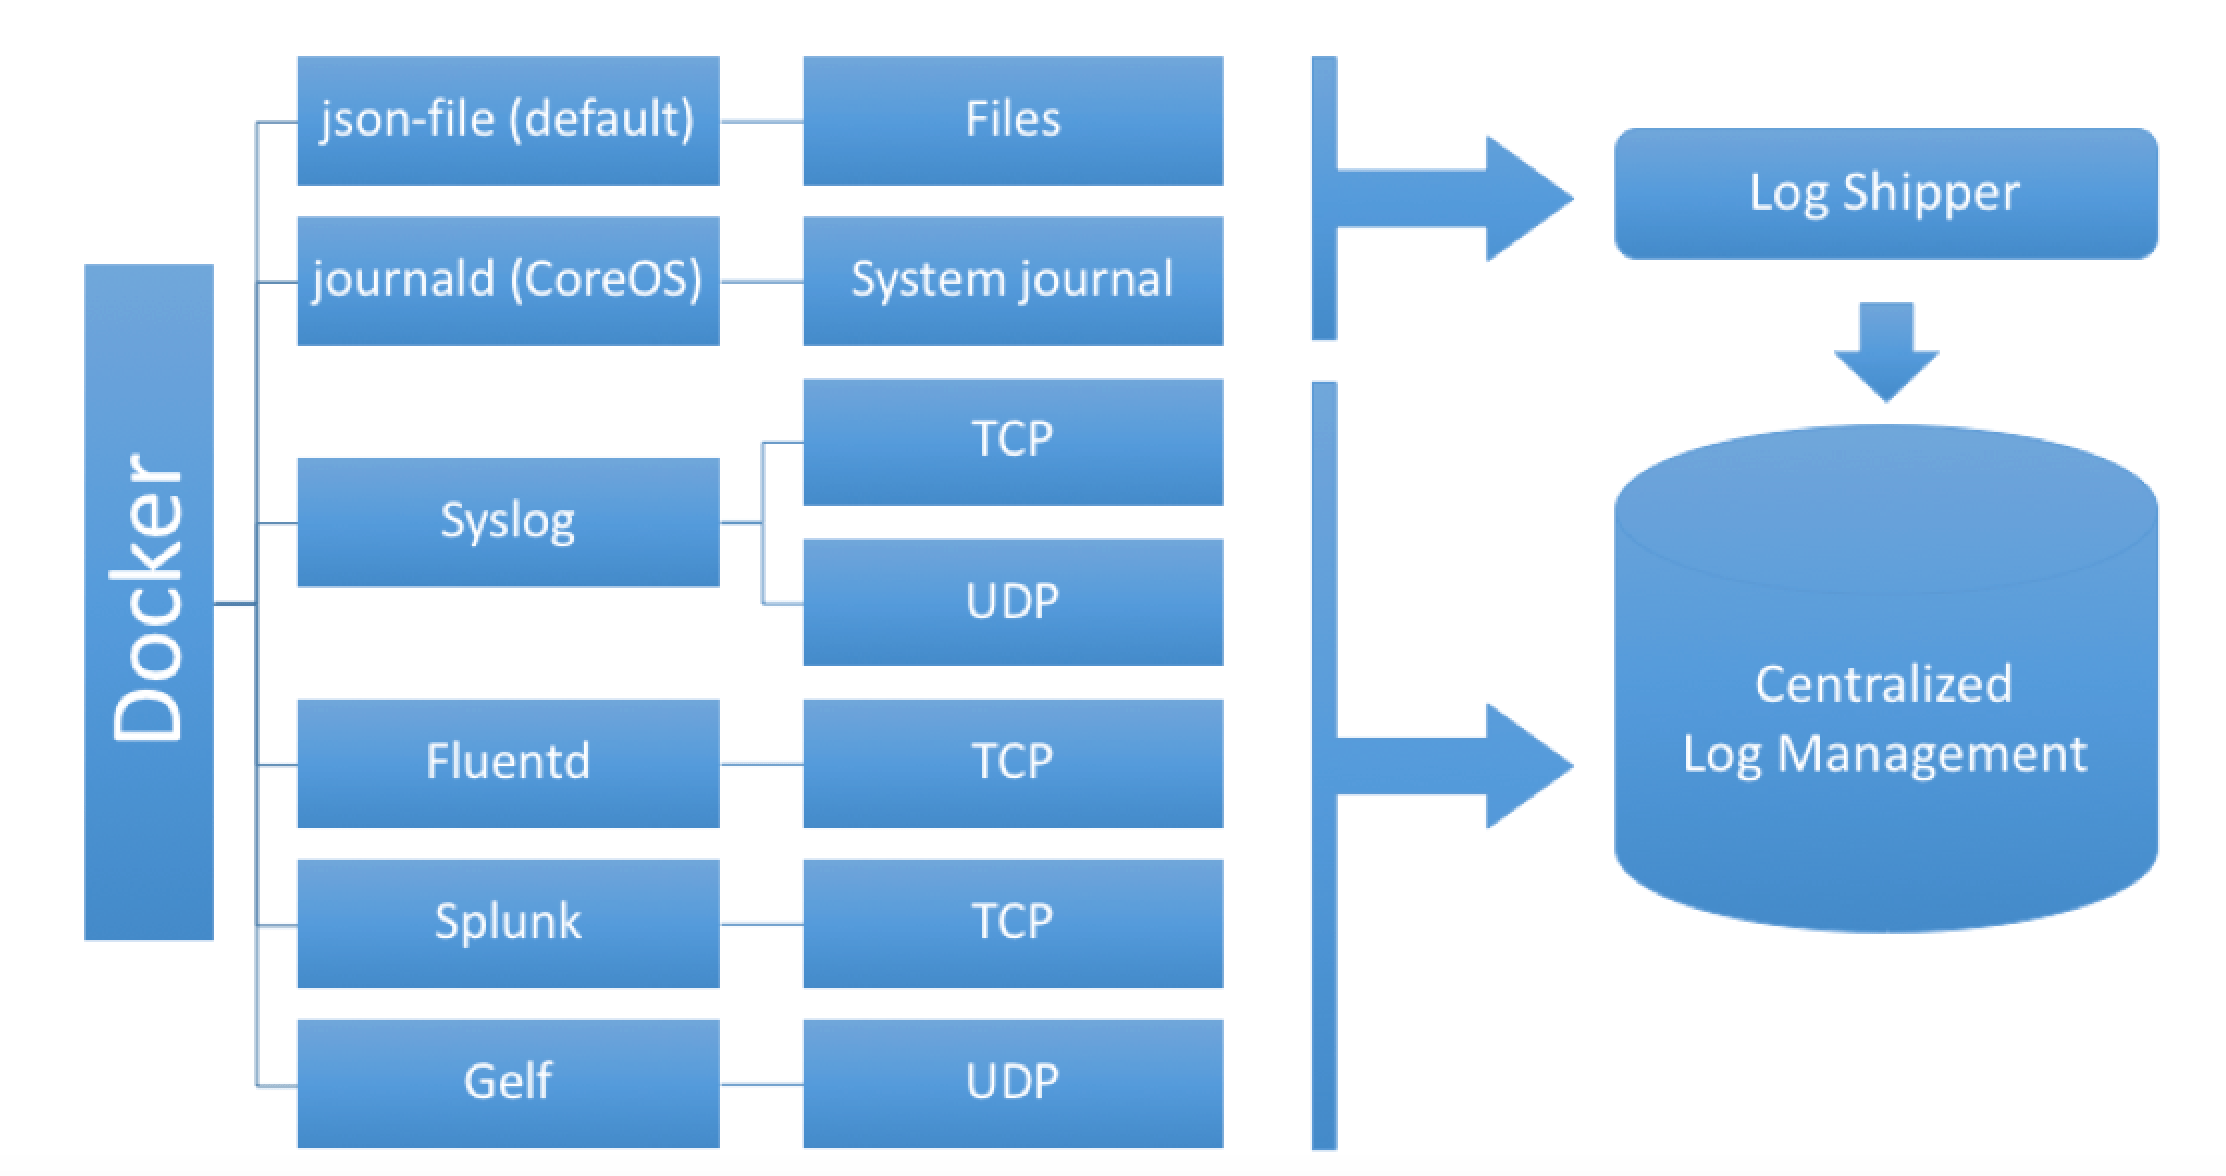
This method is ideal for modern applications designed for containerization. However, choosing the right driver and backend is key. In our last session, we used the EFK stack. Now, let's explore a popular alternative.
2. Method 1: The Logging Driver with Grafana Loki
Grafana Loki has gained significant popularity for its resource efficiency. As we briefly touched on, unlike Elasticsearch which indexes the full content of every log line, Loki only indexes a small set of metadata labels. This approach, inspired by Prometheus, can dramatically reduce storage costs and complexity.
Let's see how to configure an application to send its logs to Loki. The process is very similar to what we did with Fluentd, but uses Loki's own Docker plugin.
Central Log Management for Docker + Linux // Grafana Loki
First, let's get a clear picture of the Loki architecture and its core concepts. This video by Christian Lempa provides an excellent overview.
Watch from 03:02 to 09:49. Pay attention to the distinction between logs and metrics, and especially the architectural difference between Loki (label-based indexing) and systems like Elasticsearch (full-text indexing).
Now that you understand Loki's philosophy, let's put it into practice. The key is to install the Loki logging driver plugin for Docker and then configure our service to use it.
Central Log Management for Docker + Linux // Grafana Loki
This next segment from the same video demonstrates exactly how to configure a container to forward its logs to Loki.
Watch from 22:34 to 28:30. Focus on the two main steps: installing the Docker plugin and adding the logging configuration to a service in Docker Compose. The discussion on non-blocking mode is particularly important.
Let's summarize the essential steps to configure an application container to forward logs to Loki:
-
Install the Loki Logging Driver Plugin: This is a one-time setup on your Docker host.
docker plugin install grafana/loki-docker-driver:latest --alias loki --grant-all-permissionsYou can verify the installation with
docker plugin ls. -
Configure the Service in
docker-compose.yml:
Assume you have a Loki instance running and available athttp://loki:3100. You would configure your application service as follows:# In your docker-compose.yml services: my-app: image: some-app-image # ... other service configuration ... logging: driver: loki # The alias we used during plugin installation options: loki-url: "http://loki:3100/loki/api/v1/push" # Best practice: Use non-blocking mode for network drivers mode: "non-blocking" max-buffer-size: "4m" loki-retries: "2"
Blocking vs. Non-Blocking Mode
As highlighted in the video and supporting documentation, the mode: "non-blocking" option is critical.
Mastering Docker Logs: A Comprehensive Tutorial
The article 'Mastering Docker Logs' provides a concise explanation of Docker's log delivery modes. Understanding this is vital for building robust systems.
Read the sections 'Understanding Docker's log delivery mode' and 'Some best practices for Docker container logging'. This will clarify the trade-offs between blocking (default) and non-blocking modes.
- Blocking Mode (Default): Your application pauses its execution until the logging driver confirms receipt of the log message. If your logging service (Loki, Fluentd, etc.) is slow or down, your application will hang.
- Non-Blocking Mode: Your application hands the log message to a memory buffer and immediately continues. The driver sends logs from this buffer in the background. This prioritizes application performance but risks dropping logs if the buffer fills up. For most network-based logging, this is the preferred approach.
3. Method 2: The Log Shipper Pattern for File-Based Logs
What happens when you have an application that doesn't log to stdout? This is common with legacy applications or certain frameworks that are configured to write to log files (e.g., /var/log/my-app.log). The Docker logging driver won't capture these logs.
The solution is the log shipper pattern (often implemented as a "sidecar" container). Here, a dedicated logging agent container runs alongside your application. They share a volume, allowing the agent to read the log files written by the application and forward them.
For this, we can use Fluentd again, but in a different role. Instead of receiving logs via the forward protocol, it will actively tail a file.
Introduction to Fluentd: Collect logs and send almost anywhere
This video from 'That DevOps Guy' explains the core concepts of Fluentd and demonstrates how to configure it to read logs from files.
Watch from 00:35 to 05:01 to understand Fluentd's input/output plugins and matching. Then, watch the crucial part from 13:22 to 15:44, where he demonstrates using the tail input plugin to collect Docker container logs from the host file system. We will adapt this concept for our sidecar pattern.
Let's build a docker-compose.yml that implements this pattern. We'll have two services: webapp (which writes to a file) and log-shipper (which reads the file). For simplicity, our shipper will just print the logs to its own stdout, but it could easily be configured to send them to Elasticsearch as you learned in the previous lesson.
Project Structure:
log-shipper-demo/
├── docker-compose.yml
└── fluentd/
    ├── Dockerfile
    └── conf/
        └── fluent.conf
-
fluentd/Dockerfile: A minimal Fluentd image. No extra plugins are needed fortailandstdout.# fluentd/Dockerfile FROM fluent/fluentd:edge-debian -
fluentd/conf/fluent.conf: Configure Fluentd to tail a file.# fluentd/conf/fluent.conf <source> @type tail path /mnt/log/app.log # Path inside the shipper container where the log file is mounted pos_file /fluentd/log/app.log.pos # Fluentd uses this to remember its position in the file tag app.log <parse> @type none # Treat each line as a raw message </parse> </source> <match app.log> @type stdout # For this demo, just print the log to the shipper's stdout </match> -
docker-compose.yml: The heart of the pattern.# docker-compose.yml services: webapp: image: alpine # This command appends the date to a file every 2 seconds command: sh -c 'while true; do echo "Log entry from webapp at $(date)" >> /var/log/app.log; sleep 2; done' volumes: - app-logs:/var/log # Mount the named volume into the path where the app writes logs log-shipper: build: ./fluentd volumes: - app-logs:/mnt/log:ro # Mount the same volume, read-only depends_on: - webapp volumes: app-logs: # The shared volume
How it works:
- A named volume
app-logsis created. - The
webappcontainer writes its logs to/var/log/app.log, which resides on the sharedapp-logsvolume. - The
log-shippercontainer mounts the sameapp-logsvolume at/mnt/log. Its Fluentd process is configured totailthe file/mnt/log/app.log. - When a new line is written by
webapp, thelog-shipperreads it and forwards it based on its<match>rule (in this case, to its own console).
To test this, run docker compose up. You will see the log entries from the webapp appearing in the console output of the log-shipper container.
Test your understanding!
You have been tasked with collecting logs from two applications:
- A new Go microservice that logs structured JSON to
stdout. - A legacy PHP application that writes plain text access and error logs to
/srv/www/logs/.
Which log forwarding pattern would you choose for each, and why?
Show answer
-
Go Microservice: Use the Docker logging driver method (e.g., with
lokiorfluentd). The application already adheres to best practices by logging tostdout. This is the simplest, most efficient, and most direct way to capture its logs without any changes to the application or adding extra containers. -
Legacy PHP Application: Use the log shipper (sidecar) pattern. Since the application writes to a file, the logging driver is ineffective. You would deploy a logging agent like Fluentd or Promtail as a sidecar, share the
/srv/www/logs/directory via a volume, and configure the agent totailthe log files and forward them to your centralized system.
Conclusion
You have now mastered two fundamental patterns for getting logs from your application containers to a centralized aggregator. This gives you the versatility to handle both modern, cloud-native services and traditional, file-based applications.
Key Takeaways:
- Docker Logging Drivers are ideal for applications that log to
stdoutandstderr. Configuration is done at the container level indocker-compose.ymland is managed by the Docker daemon. - The Log Shipper Pattern is essential for applications that write to files. It uses a shared volume and a dedicated logging agent container (a "sidecar") to read and forward logs.
- For network-based logging drivers (
fluentd,loki,gelf), always use non-blocking mode in production to prevent your application from stalling if the logging endpoint is slow or unavailable. - The choice of backend (EFK, Loki) depends on your budget, performance requirements, and query patterns.
In our next lesson, we will shift from the "L" in "Observability Logs" to the "M" for "Metrics." You will learn how to configure the Docker daemon to expose metrics in Prometheus format, allowing you to monitor the health and performance of the Docker engine itself.