Hello! Welcome back to our module on Container Observability.
In the last lesson, we explored how Docker logging drivers can redirect container logs from the default json-file to centralized systems like syslog, fluentd, and Grafana Loki. We covered the "how" of configuring the driver, but now it's time to build the destination.
Today, we will put theory into practice to achieve the learning outcome: Deploy a centralized logging stack (e.g., EFK) using Docker Compose. We will build a complete, multi-container logging pipeline from scratch. For a DevOps Engineer, this is a cornerstone skill, enabling you to stand up robust observability for any containerized application.
1. What is a Centralized Logging Stack?
A centralized logging stack is a set of tools that work together to accomplish three main goals:
- Aggregation: Collect logs from multiple sources (containers, servers, applications).
- Storage & Indexing: Store the logs in a searchable, long-term database.
- Visualization & Analysis: Provide a user interface to search, graph, and analyze the log data.
One of the most established and powerful stacks is the EFK stack:
- Elasticsearch: A distributed search and analytics engine that stores and indexes the log data.
- Fluentd: A flexible and powerful open-source data collector. It ingests logs from our containers and forwards them to Elasticsearch.
- Kibana: A web interface for searching, analyzing, and visualizing the data stored in Elasticsearch.
This architecture allows you to manage logs from your entire infrastructure in one place.
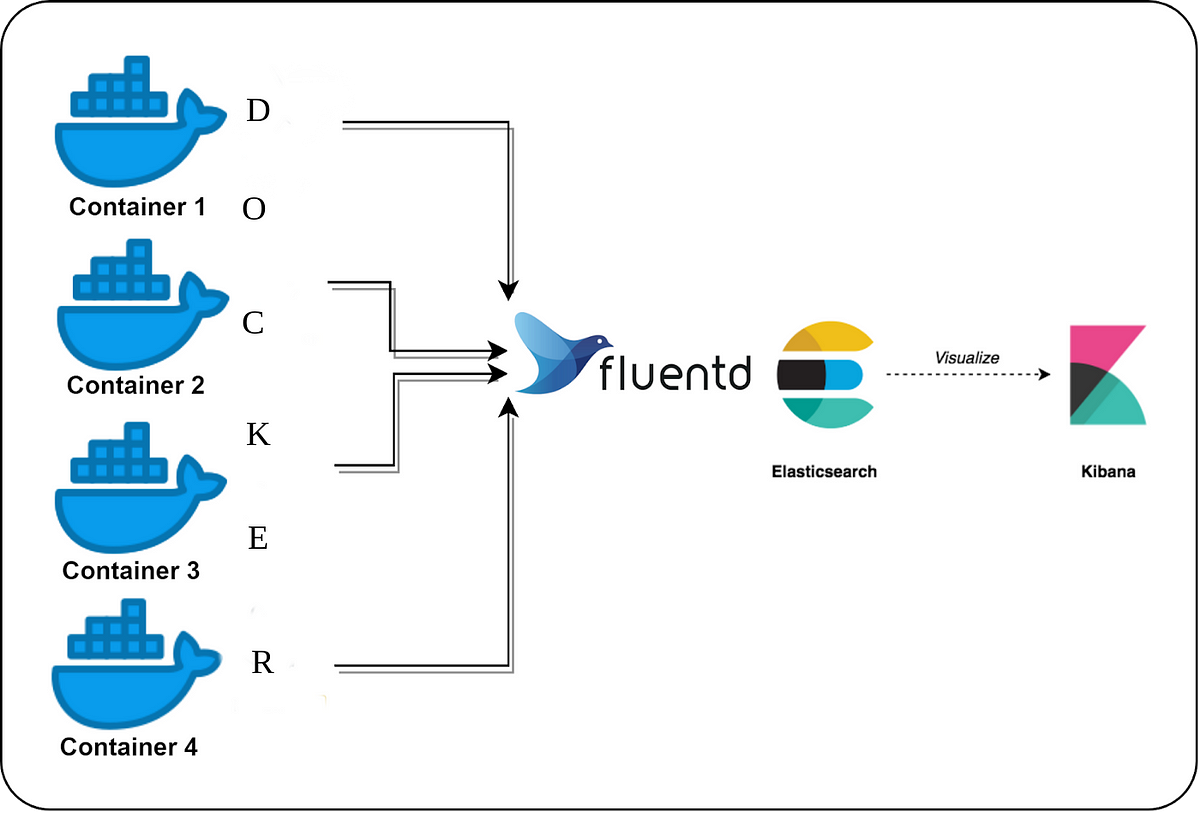
2. Building the EFK Stack with Docker Compose
We will now build a complete EFK stack, plus a sample web server application, using a single Docker Compose file. The official Fluentd documentation provides an excellent guide for this, which we will follow.
The article 'Docker Compose' from the official Fluentd documentation provides a clear, step-by-step guide to creating an EFK stack. We will use this as our primary reference.
Read the introduction and sections titled 'Step 0: Create docker-compose.yml' and 'Step 1: Create Fluentd Image with your Config + Plugin'. We will be building these files together. Pay close attention to the definition of each of the four services and the custom Fluentd configuration.
Let's break down the setup into manageable pieces.
Project Structure
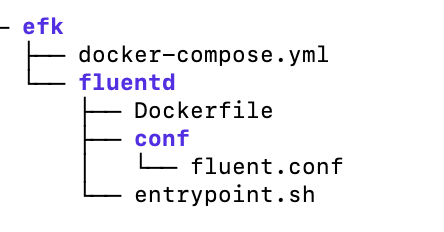
First, create a project directory. A clean structure is essential for managing multi-service applications.
mkdir efk-stack
cd efk-stack
mkdir -p fluentd/conf
Your project should look like this, which is a standard pattern for custom service configurations in Docker Compose.
The docker-compose.yml File
Create a docker-compose.yml file in your efk-stack root directory. Based on the resource you just read, we will define four services: elasticsearch, kibana, fluentd, and a web application.
Here's the complete file. Let's analyze it section by section.
# efk-stack/docker-compose.yml
services:
  web:
    image: httpd
    ports:
      - "8080:80"
    depends_on:
      - fluentd
    # This is where we connect to the previous lesson!
    logging:
      driver: "fluentd"
      options:
        # The address must be localhost, as the driver runs on the host
        # and connects to the port exposed by the fluentd container.
        fluentd-address: localhost:24224
        tag: httpd.access

  fluentd:
    build: ./fluentd
    volumes:
      - ./fluentd/conf:/fluentd/etc
    depends_on:
      elasticsearch:
        condition: service_healthy
    ports:
      - "24224:24224"
      - "24224:24224/udp"

  elasticsearch:
    image: docker.elastic.co/elasticsearch/elasticsearch:8.17.1
    container_name: elasticsearch
    environment:
      - discovery.type=single-node
      - xpack.security.enabled=false # Disable security for this example
    healthcheck:
      test: ["CMD", "curl", "-f", "http://localhost:9200/_cluster/health"]
      interval: 10s
      retries: 5
      timeout: 5s
    ports:
      - "9200:9200"
    volumes:
      - esdata:/usr/share/elasticsearch/data

  kibana:
    image: docker.elastic.co/kibana/kibana:8.17.1
    depends_on:
      elasticsearch:
        condition: service_healthy
    ports:
      - "5601:5601"

volumes:
  esdata: # Define the named volume for Elasticsearch data
Key Points in the Compose file:
elasticsearch: We use a specific version and disable security for simplicity. Ahealthcheckis defined to ensure it's ready before other services connect. A named volumeesdatais used to persist the log data.kibana&fluentd: Both usedepends_onwithcondition: service_healthyto ensure they only start after Elasticsearch is fully operational. This is a critical best practice for managing dependencies.web: This is our log-generating application. Theloggingsection is configured to use thefluentddriver, sending logs tolocalhost:24224. This address points to the port exposed by ourfluentdcontainer on the Docker host.fluentd: Instead of animage, it usesbuild: ./fluentd, telling Compose to build a custom image from thefluentddirectory.
Custom Fluentd Configuration
Now, let's create the files inside the fluentd directory.
-
fluentd/Dockerfile: We need a custom image to install the Elasticsearch plugin, which allows Fluentd to communicate with Elasticsearch.# fluentd/Dockerfile FROM fluent/fluentd:edge-debian USER root # Install the Elasticsearch plugin gem RUN gem install fluent-plugin-elasticsearch --no-document USER fluentNote: The Fluentd documentation suggests specific gem versions for compatibility. For this learning exercise, the latest version installed by default should suffice.
-
fluentd/conf/fluent.conf: This file tells Fluentd what to do with incoming data.# fluentd/conf/fluent.conf # This source listens for logs from the Docker logging driver <source> @type forward port 24224 bind 0.0.0.0 </source> # This match block processes all logs (*) <match *.**> @type copy # Store 1: Send to Elasticsearch <store> @type elasticsearch host elasticsearch # The service name from docker-compose.yml port 9200 logstash_format true logstash_prefix fluentd flush_interval 1s </store> # Store 2: Also print to stdout for easy debugging <store> @type stdout </store> </match>The
<source>block opens a port to receive logs. The<match>block uses@type copyto send the logs to two destinations: theelasticsearchcontainer and thefluentdcontainer's own standard output, which is great for debugging.
3. Deploying and Verifying the Stack
With all the files in place, you are ready to launch your centralized logging system.
Now that we have our configuration, let's deploy the stack and see the results in Kibana. The Fluentd documentation shows exactly how to do this.
Follow the instructions in 'Step 2: Start the Containers', 'Step 3: Generate httpd Access Logs', and 'Step 4: Confirm Logs from Kibana'. This will guide you through starting the stack, generating a log entry, and finding it in the Kibana UI.
To summarize the steps:
-
Start the stack from your project's root directory:
docker compose up -dThis will take a few minutes as it downloads images and builds the Fluentd container.
-
Verify the containers are running:
docker compose psYou should see all four services (
web,fluentd,elasticsearch,kibana) in theUpstate. -
Generate a log entry by making a request to the web server:
curl http://localhost:8080/This will generate an access log in the
httpdcontainer, which the Docker daemon will capture and forward to Fluentd. -
Visualize the log in Kibana:
- Open Kibana in your browser at
http://localhost:5601. - Navigate to Stack Management -> Kibana -> Data Views (or Index Patterns in older versions).
- Click Create data view.
- For the Name and Index pattern, enter
fluentd-*. - Select
@timestampas the timestamp field and create the data view. - Finally, click the top-left menu and go to Discover. You should see the log entry from your
curlcommand!
- Open Kibana in your browser at
The video below also provides a good visual walkthrough of the final result, including exploring the Kibana dashboard.
[ ElasticSearch 3 ] How to install EFK stack using Docker with Fluentd
The video '[ ElasticSearch 3 ] How to install EFK stack' demonstrates what the final result looks like. While it uses a slightly different setup method, the Kibana part is very relevant.
Watch from 26:29 to 29:57. This section shows exactly how to create an index pattern in Kibana and then find and filter the logs in the 'Discover' view. This is the payoff for all our configuration work.
Test your understanding!
In our docker-compose.yml, the web service sends logs to localhost:24224, while the fluentd service sends logs to host: elasticsearch. Why the difference?
Show answer
- The
webservice's logging is handled by the Docker logging driver, which runs on the Docker host machine, not inside a container network. It connects to the port (24224) that thefluentdcontainer exposes on the host (localhost). - The
fluentdservice is a container communicating with another container (elasticsearch) within the same Docker Compose network. Docker Compose provides automatic service discovery, so it can use the service name (elasticsearch) as a hostname to connect to the other container's port (9200).
4. A Quick Look at the Alternative: Grafana Loki
The EFK stack is incredibly powerful, but it can be resource-intensive. As we touched on in the last lesson, a popular modern alternative, especially in cloud-native environments, is the stack built around Grafana Loki.
Central Log Management for Docker + Linux // Grafana Loki
To give you a broader perspective as a DevOps professional, let's briefly revisit Grafana Loki. This video explains its core philosophy.
Watch from 03:02 to 07:10. The presenter, Christian Lempa, gives a great overview of Loki's architecture and how it differs from Elasticsearch. Focus on the core idea: Loki indexes labels (metadata), not the full log content.
- EFK Stack: Indexes the full text of every log message. This makes searching incredibly powerful but requires more storage and CPU/memory.
- Loki Stack: Only indexes a small set of labels (like
app="nginx",env="prod"). This makes it much lighter and more cost-effective, but searching relies on querying these labels first, then filtering the log content.
For many modern use cases where you debug by filtering on application name, request ID, or environment, Loki is a compelling and efficient choice.
Conclusion
Congratulations! You have successfully deployed a production-grade, centralized logging stack using Docker Compose. You now have the practical skills to collect, store, and visualize logs from any containerized application.
Key Takeaways:
- A logging stack consists of aggregation (Fluentd), storage (Elasticsearch), and visualization (Kibana) components.
- Docker Compose is the perfect tool for defining, configuring, and running these multi-service applications.
depends_onwithcondition: service_healthyis crucial for ensuring services start in the correct order.- A custom
Dockerfilefor Fluentd is needed to install plugins for backends like Elasticsearch. - Application containers are configured with the
loggingdriver to send logs to the aggregator, which listens on a port exposed to the Docker host.
In our next lesson, we will build upon this foundation. We configured our app using Docker's built-in logging driver, which is great for stdout/stderr. Next, we'll configure application containers to forward logs to a centralized aggregator using other common patterns, such as sidecar containers that can read logs from files, and discuss the importance of structured logging within your applications.